Trading Kumo Breaks
Traditionally, the Ichimoku Cloud is known for its ability to pick up trends and keep traders in them until they are over.It should be noted that any system or method which is good at finding trends is also good at finding reversals because if you are finding the times/locations when trends are ending, then you are finding consequently a reversal.
There are several components inside the Ichimoku Cloud which give it a unique capacity to find trends, establish if we are in a trend, which direction and when it is over.One of them is the Kumo or Cloud which is one of the most unique technical indicators out there.
Kumo Composition
There are two main lines of the Kumo which are referred to as Senkou Span A and Senkou Span B. For the purposes of efficiency, we will refer to them as Span A and Span B. The space or value in between these two lines is what forms the Kumo.
Span A is formed by taking the Tenkan Line and adding it to the Kijun Line (white and red lines respectively from chart above), then dividing that value by 2 and plotting it 26 periods ahead. The formula is;
(Tenkan Line + Kijun Line) / 2 placed 26 periods ahead
Span B is formed by taking the highest high (over the last 52 periods), adding to it the lowest low (over the last 52 periods), dividing that by 2 and plotting that 26 time periods ahead. The formula is;
(Highest High + Lowest Low for the last 52 periods) / 2 and plotted 26 time periods ahead.
What is it used for?
The most important way to look at the Kumo is as support and resistance – meaning if it is thick, then the support/resistance (depending upon where price is in relationship to the cloud) is strong. If price is above the Kumo, we are in a general uptrend or would want to look for more buying opportunities. If price is below the cloud, it is below resistance (the Kumo) and we want to be searching for more shorts than longs. The longer price stays below/above the cloud, the stronger the trend we are in and the more support/resistance the Kumo will offer.
These are generic ways to look at it but effective.What is important to note is in trends, price will stay on one side of the Kumo.The farther price is from it, the stronger the trend and more volatile it is.Thus, the Kumo can be a very effective tool for option traders as well as trend/momentum traders.
How can we use it for Reversals?
Because the Kumo will often hold price on one side of it, when price breaks it, such a move can often signal a reversal.There are various factors which will increase the likelihood of a reversal such as:
- Thickness of the kumo when broken
- How long price has been on one side of it
- How far price has moved before touching/piercing the kumo
- What time frame you are working on
These are all critical when assessing whether a Kumo break is signifying a reversal or not.
A few examples
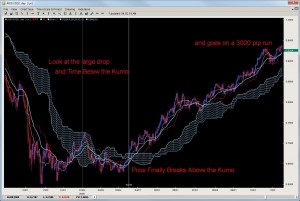
Take a look a the AUDUSD below.It was below the Kumo for a long period of time and had a massive fall.Then after a couple of attempts on the daily chart, broke above the Kumo.Now remember the Kumo represents support and resistance so the pair breaking above it, then coming back to the Kumo to treat it as support was a great role-reversal play.After retouching the Kumo, it went on a 3000 pip run!

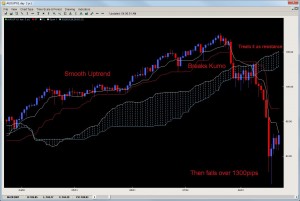
Another example is on the AUDJPY on the daily chart which was on a smooth consistent uptrend.Look what happened when it broke the kumo.It took a few days, but then after attempting to break back above, treated the Kumo as resistance, and the pair then fell over 1300 pips in a few months.

Final Notes
The Kumo breakout strategy is one of the key systems used by Ichimoku traders for spotting key reversals, qualifying them and giving traders a unique opportunity to either take profits or reverse positions.Its great for timing trends, reversals and trading key reversals when they are in play.Because of its unique ability to measure support and resistance, the Ichimoku Cloud and its Kumo construction offer the trader some unique trade opportunities.
It should be noted there are other key elements needed to trade the Kumo Breaks with precision.We have analyzed Kumo breaks on Forex, Futures, Commodities and Indices over the last 10 years and with our proprietary indicators and analytical programs, are able to give precise measurements for how far and long a Kumo break should travel which gives you a precision edge when trading them.
To learn more about our proprietary Ichimoku trading strategies and systems, visit our Advanced Ichimoku Course where you will get access to 10 years of proprietary quantitative data on how to trade Ichimoku Clouds.

magnificent post, very informative!