Not all dips are worth buying, especially for biotech stocks that don’t seem like they may ever make their way up again. But we have substantial reasons to believe the Vertex Pharmaceuticals (Nasdaq: VRTX) stock is far from being a debbie-downer.

Founded in 1989, Vertex Pharmaceuticals commits itself to the research, development, and manufacture of drugs to treat serious illnesses, such as cystic fibrosis (CF).

Good News! This Growth Stock Has Fallen By Over 40% 01

(Image Source: Chokniti Khongchum)

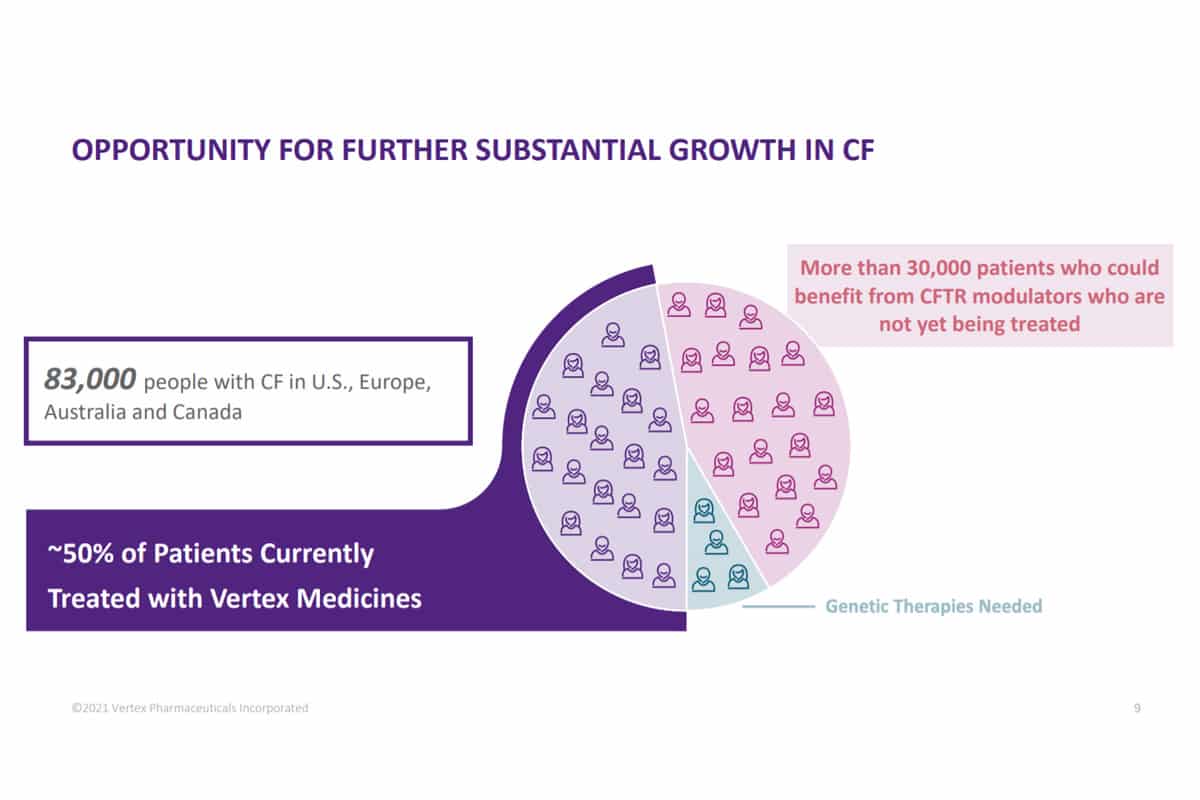
Growth should not be a problem for Vertex, especially with its CFTR modulators, Trikafta and Kaftrio. About 83,000 people in Australia, Canada, Europe, and the US have CF. Vertex’s CFTR modulators are being used to treat about half of the number. There are still There are over 30,000 patients who can be treated by the drugs but are yet to be treated. The stock gets even more attractive when you consider the fact that there are no major competitors for Vertex that might take some of the company’s potential CF patients.
Good News! This Growth Stock Has Fallen By Over 40% 02

(Image Source: Vertex Pharmaceuticals)

Another potential growth opportunity for Vertex is in cell and genetic therapies that could spell an end to sickle cell disease and beta-thalassemia. The company is currently testing its medicine, CTX001, and may file for approval within the next 2 years. If the company is successful and pushes the drug to the market, there are over 150,000 potential patients in Europe and the US.

Vertex has also had reasons to smile about its revenue growth. The company gathered $1.8 billion in revenues after Q2 of FY 21. This was an 18% growth from what it made in the same period of last year.

All things considered, the future looks bright for Vertex Pharmaceuticals.

Technical Analysis

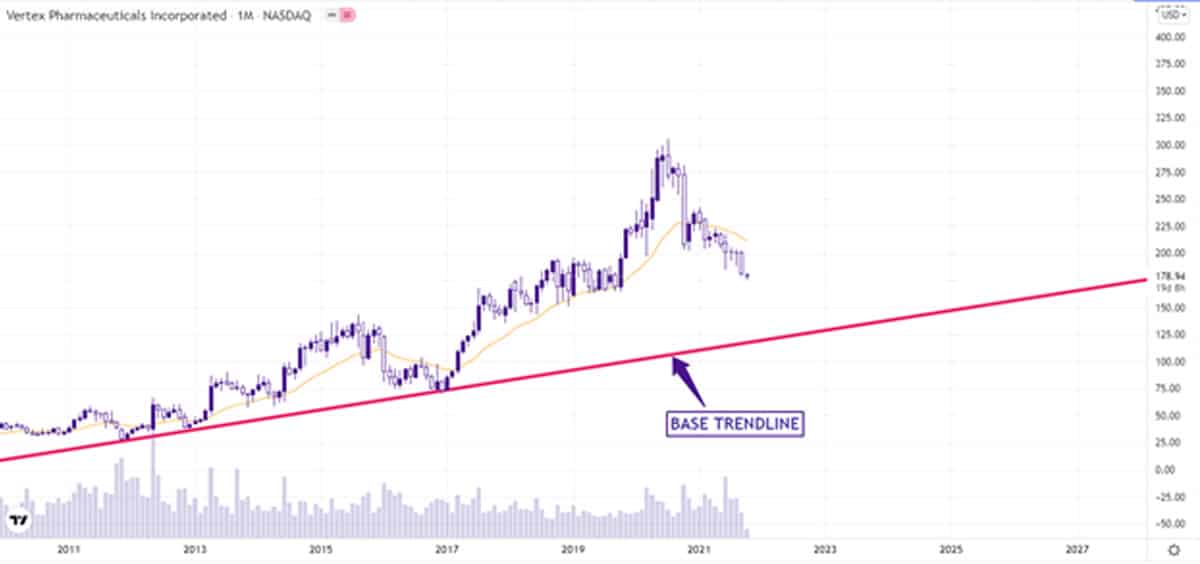
Vertex stock soared to an all-time high of $299.21 in July 2020. It has since fallen by over 40%. But there’s every reason to believe we’re only seeing a corrective pullback to the base trendline and nothing more.

Good News! This Growth Stock Has Fallen By Over 40% 03

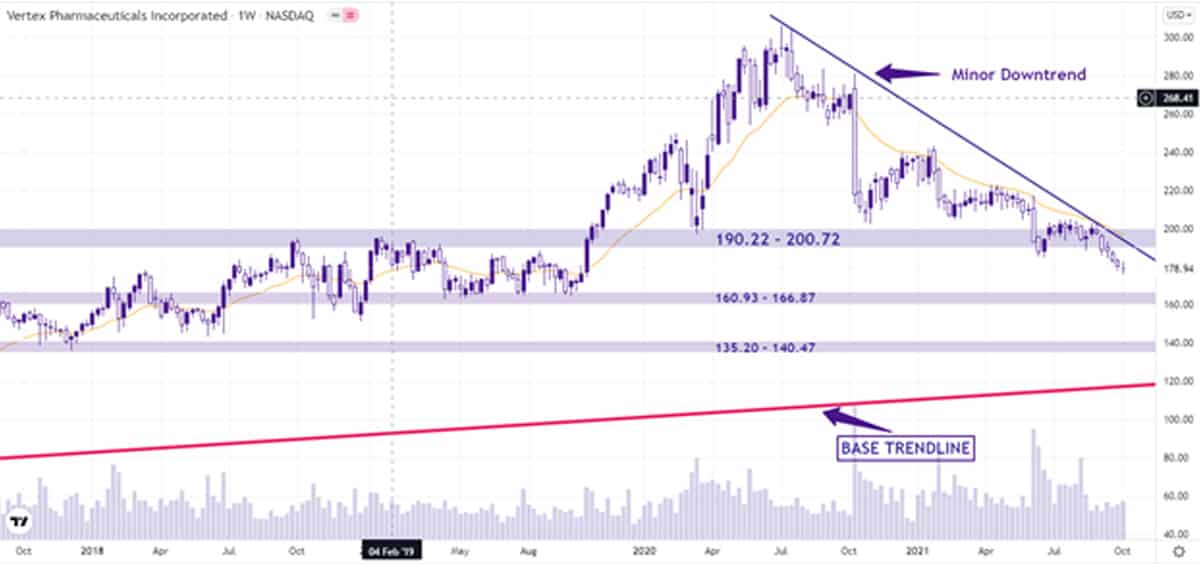
The price is well above the base trendline at the moment and may well continue its dip to that level. However, the price will have to go past two support levels ($160.93 – $166.87 and $135.20 – $140.47) to do that. Any of these two support levels could serve as a viable level from which the price charges out of the minor downtrend it has embarked on.

Good News! This Growth Stock Has Fallen By Over 40% 04

Options Positioning

The options trading market is showing about 43K calls and 35K puts, so a mild stock in terms of option volume and positioning. I’m seeing about 55% of the options rolling off this Friday, which could put pressure on the stock short term.

The first pullback support zone mentioned between $160-$166 will be our first level to consider longs.

FULL DISCLOSURE: Chris Capre currently has no stock or option position in VRTX. If you’d like to learn more about Chris’s trades and positions, you can get access via the Trading Masterclass where he shares his live trades, further investment ideas and daily market analysis.

Coupa Software (NASDAQ: COUP) is a hot stock in the enterprise software sector, overtaking the automated enterprise procurement market.

Coupa already has 2000 customers, with big clients such as Walmart and Amazon, since the company was founded, their platform already has processed an impressive $2.8 trillion in transactions.

Laptop on glass table showing data

As most big tech companies these days, Coupa is heavy into artificial intelligence. Every transaction that goes through Coupa’s platform is generating data points, as we know, data is one of the most critical and valuable assets in the field of AI.

Something that we really like about Coupa’s business model is the fact that its platform integrates itself into the customers operations, finance and supply chain. Why do we like that? Well, this means, that if a company decides to quit/leave, it’ll likely be a difficult, time-consuming, and expensive process because Coupa’s software is so deeply engrained in all major operations processes of the company. This makes Coupa a ‘sticky’ product which is strongly positive from a customer retention standpoint. Companies will definitely have to think twice before cancelling Coupa’s services and/or switch to another provider.

Industry analysts have also named Coupa’s procurement platform a leader and benchmark in the industry which communicates a lot about the quality of the service and product.

In terms of unrealized market potential, Coupa estimates their global customer potential to more than 100,000, equaling a whooping €94 billion in addressable market opportunity!

Coupa Addressable Market Opportunity

(Source: Coupa)

Considering Coupa’s already strong position, combined with the unrealized market potential, makes us think Coupa is only warming up and could become a real market-cap giant in the next decade or two if the company plays its cards right.

Technical Analysis

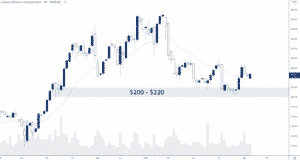
COUP Stock Chart 2ndSkies Trading

Since its all-time-high in February, the stock price of Coupa is down -35% at the time of this writing. The stock did recently find strong support in the range of $200-$220 which lead to a bullish impulsive move, indicating solid bullish interest at this support zone.

On weak pullbacks, we do think $200-$220 is a solid first support zone for investors to watch out for. A failure of this support however would open up a substantial amount of downside in the stock with $100-$125 being the next strong support in line.

Option Positioning

Looking at the option positioning, there are about 51K calls and 58K puts, so a tad put heavy. There are no short dated expiries to cause short term pressure on the stock.

Option gamma positioning is suggesting there is potential support between $200 and $210, matching our first technical support zone.

FULL DISCLOSURE: Chris Capre currently has no stock or option position in COUP. If you’d like to learn more about Chris’s trades and positions, you can get access via the Trading Masterclass where he shares his live trades, further investment ideas and daily market analysis.
When it comes to different semiconductor products, a handful of companies are controlling most of the market. This is no different for DRAM products (dynamic random-access memory) which are used in a wide range of products such as PC’s,  mobile devices and 5G tech.

Computer ram memory on leather surface

The 3 major players in the DRAM market today are Samsung, SK Hynix and Micron Technology and today we’re going to talk about the one located in the US, i.e., Micron Technology (NYSE: MU).

Overall Micron Technology’s business is cyclical in nature, but with the DRAM market now being heavily consolidated, coupled with strong demand across the board, this should help to keep prices stable at current elevated levels for some time.

The US has the world’s 2nd largest semiconductor demand which Micron, due to its location can take full advantage of. This is confirmed by the company’s latest revenue numbers for the quarter ending May 31st, which clocked in at $7.4 billion, up 36.5% year-over-year.

In general, tech-stocks tend to be expensive. But Micron, with a strong balance sheet and solid debt vs cash ratio at 0.16, looks rather cheap compared to most tech-stocks these days.

Based on the strong demand in the sector and lack of competition, coupled with the stocks price action, we do think Micron Technology could be a solid long-term buy on solid pullbacks into a good price range.

Technical Analysis

MU Stock Chart 2ndSkies Trading

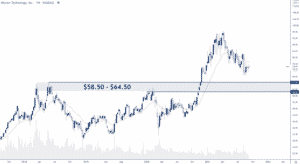
The stock was confined within a 30-dollar-range for quite some time, but towards the end of last year, price broke out to the upside, followed by a solid bull run resulting in a 80+% gain in 5 months.

The stock topped out at around $97 end of March this year and has since been in a corrective pullback, indicating that bulls are still are present. For now, we do not see any indication of a bullish transition or reversal and think that the top of the old range between $58.5-$64.5 is a good location to start looking for potential longs in this stock.

Option Positioning

In Micron there are about 725K calls and 843K puts, so slightly heavy on the put side, which is to be expected considering its been consistently bearish for months lately. I don’t see any changes in gamma hedging or option positioning till we get to the high 50’s or low 60’s, which is supported by our price action analysis above.

FULL DISCLOSURE: Chris Capre currently has no stock or option position in MU. If you’d like to learn more about Chris’s trades and positions, you can get access via the Trading Masterclass where he shares his live trades, further investment ideas and daily market analysis.
Throughout the pandemic, many turned to pets for comfort, seeing pet ownership grow rapidly in the last 18 months. One company likely to benefit from this long-term is Trupanion (NASDAQ: TRUP), the market leading pet insurer in the US.

Happy Dog Sitting on a Field of Grass

New pet owners can easily forget about the importance about getting an insurance for their new companion right away, but as soon as they get the first bill from the vet, that’s likely to change, which means the increase in ownership we’ve seen during the pandemic, likely slowly will spill over into the insurance market over time.

In North America alone, pet owners spend over $62 billion caring for their 180 million dogs/cats but despite this, only 1-2% of the total # of pets in the US/Canada are insured which is nothing compared to Europe.

For example, in Sweden a whooping 40% of pets are insured and in the UK this number stands at 25%. This should give you an idea about how much untapped potential there is available in the US market.

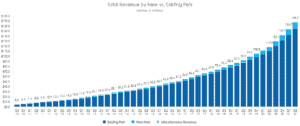
Even before the pandemic hit, Trupanion already showed impressive and stable growth over time, with a revenue growth of 20%+ for 55 quarters in a row!

Trupanion Revenue Growth

(Source: Trupanion)

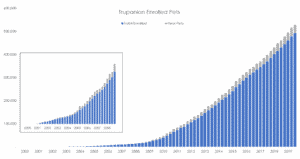
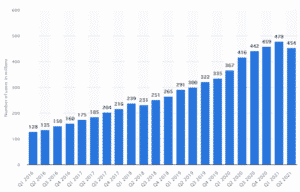
Also, the growth curve of pets enrolled in a Trupanion insurance is nothing less of impressive.

Trupanione Enrolled Pets

(Source: Trupanion)

In Q2 this year alone, the company’s income increased to $18.5 million, up 32% compared to Q2 2020 further confirming that the company’s consistency in terms of growth remains uninterrupted.

Another impressive metric of Trupanion is their incredible 98.72% monthly customer retention rate, a number most other companies only can dream of.

Trupanion not only looks like a very stable and well-managed company, but also impresses with a strong YoY growth in a market that is on the rise. Thus, we think this stock makes a great candidate for long-term oriented investors.

Technical Analysis

TRUP Stock Chart 2ndSkies Trading

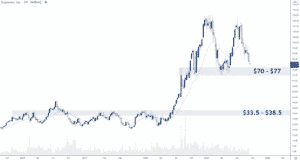
Following the massive 300%+ bull run in Q3/Q4 last year, the stock topped out with at around $120, forming a long-term range between $70 and $120. Price is now closing in on the long-term support zone between $70-$77 which we think is a solid first location to look for potential longs.

However, should this support fail, the next structural support does not come in until $33.50-$38.50 which is our second buy zone for this stock.

Option Positioning

This is an incredibly low option volume stock with 2K calls and 8K puts, so our option data comes with a grain of salt. Support should start to build around $70/75 in congruence with the technical analysis.

FULL DISCLOSURE: Chris Capre currently has no stock or option position in TRUP. If you’d like to learn more about Chris’s trades and positions, you can get access via the Trading Masterclass where he shares his live trades, further investment ideas and daily market analysis.

“One man’s loss is another man’s profit”. This couldn’t be more true for MarineMax (NYSE: HZO). Whilst the pandemic wreaked havoc on the global travel industry, companies focused on domestic recreational activities saw a massive boost.

Motorboat heading into sunset

MarineMax is the worlds largest recreational boat & yacht seller which has seen both their revenue and net income skyrocket during the pandemic.

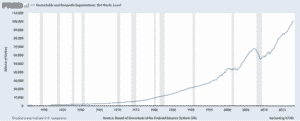
However, the pandemic is not the only contributing factor. Thanks to the booming stock/housing market and low interest rates, household net worth across the globe has soared to new all-time highs in the last 10 years.

US Household Net Worth Graph

One company benefitting from this massive increase in wealth (and inequality growth) is MarineMax as high-net worth households like to invest in (and show off) luxury products.

Besides selling boats, a business that fluctuates based on seasonality, the company also operates 30+ marinas, providing charter services, storage and more which gives the company a reliable and steady stream of cash flow.

Financially the company is delivering one record-breaking report after the other.

Below are a few key points from MarineMax’s recent financial report:

  • Record June Quarter Revenue Grows 34% to Almost $667 Million
  • Same-Store Sales Grew 6% on Top of 37% in the Prior Year
  • Gross Margin Expands to Nearly 31% – A Record For The June Quarter
  • Record June Quarter Diluted EPS Increases 64% to $2.59

And if you look at Q1 and Q2 reports, you’ll should notice the word “record” showing up frequently across the board.

Despite a strong bull-run in the stock in the last 1,5 years, thanks to the record-breaking increase in revenue and a 30% drop in the stock price recently, the price to earnings ratio has been pushed back below 8, which in today’s market can be considered cheap (Amazon for example is trading at a P/E ratio of 60).

Overall, we like HZO as a potential investment and think that there is more upside potential for the stock which the market hasn’t been priced in yet by the market.

Technical Analysis
HZO Stock Chart 2ndSkies Trading

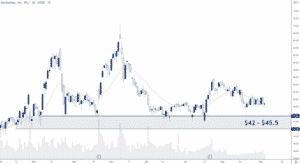
The stock topped out at around $70 in May, following a 750+% bull run in 14 months. Since then, the stock has sold off 30% and is currently trading at around $49.

Price is trading close to $42 and $45.5 which price action indicates is a strong area of support for this stock. We think that potential pullbacks into this support zone can offer bulls looking to acquire shares of MarineMax a good opportunity to do so.

Option Positioning

This is and incredibly low options volume stock with only 6K options floating out there. Hence we take option data with a grain of salt when viewing them with these numbers.

But we think support will come in around the low 40’s.

FULL DISCLOSURE: Chris Capre currently has no stock or option position in HZO. If you’d like to learn more about Chris’s trades and positions, you can get access via the Trading Masterclass where he shares his live trades, further investment ideas and daily market analysis.

Following a successful IPO and strong rally in 2014, investors quickly abandoned GoPro (NASDAQ: GPRO) which led to a -98% collapse in the stock in the years that followed.

Since the outbreak of the pandemic however, headwinds seem to finally be turning into tailwinds for the company.

GoPro on a desk with cameras

The main driver behind this transition is the restructuring process of the company, shifting more towards an e-commerce and subscription based model. This shift is now starting to bear fruits, which lead to an impressive 86% YoY increase in revenue in Q2 (Source: GoPro).

In terms of the new subscription models, GoPro has launched two new services.

The main service, which is priced at $50/year includes a camera insurance, up to 50% discount on products sold via the company’s website and unlimited cloud storage (you can never get enough storage, can you?).

The other subscription service is a photo editing app called Quik priced at $10/year.

From a cost vs value perspective, a solid bang for the buck if you ask me and customers seem to agree as the # of active subscribers in Q2 this year exceeded 1 million for the first time (up 211% YoY). The company expects to surpass 1.7 million subscribers by the end of the year which if realized would be impressive to say the least and should leave a positive imprint both in terms of revenue and stock price.

Overall, it seems the company is pulling all the right strings with both quarterly earnings reports and the stock agreeing. If the company manages to further build upon this transition, we think that at the right price, this stock is a solid candidate for investors looking for growth-investment opportunities.

Technical Analysis

GPRO Stock Chart 2ndSkies Trading

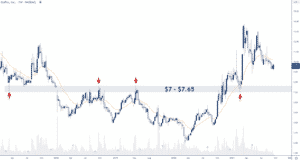
The failed breakout lower in March 2020 attracted a strong amount of bullish interest, leading to a transition in the price action from bearish to bullish.

Then in November last year, bulls successfully cleared the key resistance between $7-$7.65 which then acted as support for a 95% rip higher.

Following this strong bull run, the stock has been slowly pulling back towards this support again with price action suggesting there’s more downside to come short-term.

If we can make it back all the way to the key support, we think that the $7-$7.65 price range is a good buy zone for this stock.

Option Positioning

GPRO is a low key stock in terms of options volume with only 86K calls and 48K puts, so ‘light’ in terms of options volume.

But we do see some option support around $9, and the lower we go, the more likely support comes in.

FULL DISCLOSURE: Chris Capre currently has no stock or option position in GPRO. If you’d like to learn more about Chris’s trades and positions, you can get access via the Trading Masterclass where he shares his live trades, further investment ideas and daily market analysis.
The global adoption of e-sports has taken time, but at this point it should be out of the question that e-sports is here to stay and very likely will enjoy massive growth over years to come. Global revenue is expected to increase 15% and reach more than $1 billion in 2021.

Gaming Desktop Setup

One company, that only has scratched the surface in this field so far is the skill-based company Skillz (NYSE: SKLZ).

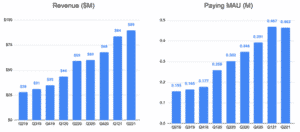
Skillz business is growing rapidly with a 52% revenue growth year-over-year in Q2 with paying monthly active users (MAU) being up 53%.

Skillz Quarterly Revenue & Paying Mau Growth

(Source: Skillz Q2-21 Shareholder Letter)

Also, in August, Skillz invested $50 million for a small stake in Exit Games which opens up the possibility for the company to expand their business into games such as FPS (first person shooters) and battle royale which are fast growing genres.

Now, despite the fast-growth and massive future potential of the esports market, investors are clearly realizing (and pricing in) that Skillz is facing strong headwinds on top of the companies extremely aggressive marketing strategy.

For example, the company did spend 111% of its Q1-revenue on marketing, yes, you read that correctly. This is a lot even for a company focusing on aggressive growth, almost bordering on desperation. So far, this marketing strategy isn’t working out as planned for the company, i.e., it’s not bringing in the expected number of new customers.

Thus, for the bearish trend to reverse into a bullish one, the management of Skillz clearly must come up with a new customer-acquisition strategy. This is clearly something investors also are aware of, which is likely why the stock has given back 3/4 of its gains in the last 6 months.

But there is light in the tunnel such as the company focusing on and investing in new content and data science, the partnership with Exit Games and the acquisition of Aarki which is an AI-enabled mobile marketing platform that should help to bring marketing costs down significantly over time.

In conclusion, we think Skillz still has a lot to prove in terms of stability and how to turn the business profitable before becoming a solid buy. However, with the stock being back at IPO levels after taking a massive beating, aggressive investors might find that the potential reward, if the company can get things right, might outweigh the risk and justify a small long-term investment. In other words, we think Skillz is a potential high-risk/high-reward play, but not a stock we’d recommend for conservative investors, at least not yet.

Technical Analysis

SKLZ Stock Chart 2ndSkies Trading

The stock currently is down more than 75% since its all-time-high in February this year which is a massive drop and reality-check. Price is now trading slightly above the IPO levels which is the price range the last strong bull-run emerged from.

The stock bounced +20% in the end of August from this price range confirming that there is a good amount of unrealized bullish order flow waiting in this area.

For investors interested in acquiring shares of Skillz, we do think this support between $10-$10.60 offers a good price range to look for buying opportunities.

Option Positioning

Currently there are about 245K calls and 145K puts, so a call heavy option market. 35% of the gamma is rolling off this Friday, so should create some headwinds till then. Option positioning suggests $10 could act as a decent support.

FULL DISCLOSURE: Chris Capre currently has no stock or option position in SKLZ. If you’d like to learn more about Chris’s trades and positions, you can get access via the Trading Masterclass where he shares his live trades, further investment ideas and daily market analysis.

Splunk (Nasdaq: SPLK) is a cybersecurity and data analytics software company based in San Francisco trusted by 91 of the Fortune 100 companies.

Is This Growth Stock Ripe for the Picking?


The company has a usage-based pricing model that thrives with its customers, meaning that every time their customers increase the usage of a product or adopt a new one, prices go up and Splunk earns more money, creating a win-win situation for both parties.

On top of this, the company is in a 2-year transition period, moving away from a license-based model to a full SaaS subscription model which should help to ensure and stabilize future cash flow for the company.

Initially, the primary business of Splunk was focused on cybersecurity only, but over time, the company has evolved to become one of the biggest machine-data focused company out there with New Relic and Datadog being its closest publicly traded competitors.

Worth nothing is that Silver Lake Partners recently made a $1 billion convertible stock investment with a strike price $10 above current price which not only communicates long-term confidence in the company but also in the stock direction.

In conclusion, a high-flying SaaS company and growth stock like Splunk, operating with a price to sales ratio of under 10 is hard to find these days and a bargain in the world of tech stocks.

This, coupled with the fact that the stock still is trading 33% below its all-time-high from last year plus has put in a solid reversal structure makes us think that there’s a good amount of potential upside available in Splunk, both from a mid-term trading opportunity, but also from a long-term perspective.

Technical Analysis

SPLK Stock Chart 2ndSkies Trading

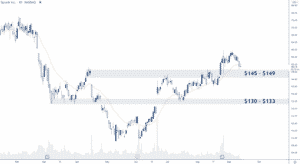
Starting 2021 by selling off -35%, in May/June the stock started to stabilize. After successfully building a base and double bottom around $112, the stock has staged a solid comeback and reversal structure.

In late August, buyers managed to clear the key resistance between $145-$149 which we think is a good first location for investors looking to acquire shares of Splunk. Should this area fail to hold as support, we see the next solid area of support coming in at around $130-$133.

Option Positioning

Currently there are 145K calls and 82K puts out there on SPLK, so not a big stock in terms of options volume. $145 is looking like a solid support short term and there are no short dated expiries to affect the price materially one way or another.

FULL DISCLOSURE: Chris Capre currently has no stock or option position in SPLK. If you’d like to learn more about Chris’s trades and positions, you can get access via the Trading Masterclass where he shares his live trades, further investment ideas and daily market analysis.