This is part 1 of a 4 part forex price action strategy series. Read the next one here: The Blind Entry (How It Will Leave You Trading Blind)

I can always tell where people are in the trading process based on how they speak about confirmation. Why is that? Watch, and find out!

Here’s the transcription for the video:

“There’s a really big misunderstanding about confirmation.

When I hear people talk about confirmation and how they talk about confirmation, I can always tell where people are in the trading process based on how they speak about confirmation. Why is that?

Because there’s been this proliferated idea in the trading education world that to trade a setup or trend or something like that you need this thing called confirmation and the confirmation comes in the form of a pin bar, an engulfing bar, an inside bar or whatever.

So that’s the general idea that’s out there when it comes to trading price action.

The thing is, is that when I hear somebody talk about price action in this way, I know exactly what level of trader they are and what level of trader they’re not, because how somebody speaks about confirmation is very indicative of where they are in their trading process.

If a trader is looking for confirmation that a trade will work and they’re doing this because they’re saying “ok, we gotta wait for a price action confirmation signal from support or resistance“.

Well, where does this idea and need for confirmation come from? It comes from a beginner’s understanding of trading.

Why is that?

Because beginning traders are looking for certainty in the market. They’re looking for solidarity, they’re looking for something really really potent that says “I need confirmation”.

The reason why they need confirmation is because they don’t trust price action, they don’t trust their skillset.

They don’t trust trading as a whole. They don’t trust trading with trends, they don’t trust reversals. They don’t trust support and resistance, they don’t trust price action as a whole.

In the beginning, traders want solidarity, they want certainty. And because of that, they’re looking for confirmation in the form of a pin bar or something like that.

The pin bar ‘confirms’ that this trend is going to continue.

The thing about it i,s is that this is something that professional traders have let go of that a long time ago. And they have to let go of it to become a professional trader.

The reason why that is, is because that idea of certainty, of confirmation and the way that a beginning trader is looking for it, that wanting things to be really certain, that A++ setup.

Where that comes from is a beginning understanding of trading.

“Professional traders don’t look for certainty, because they’ve realized it’s an illusion.”

What professional traders are looking at, which is a different perspective, is trading and thinking probability.

So if you hear somebody talking about confirmation, “we wanna trade with the downtrend and we’re gonna wait for a pullback towards resistance and a pin bar off that resistance as confirmation that the trend is still in play and we can trade it“.

How many have heard that story before?

The reason why you’ve been told that is because the people who are teaching that aren’t trading professionally.

If they were you would know this, and all professional traders would know this because professionals aren’t looking for confirmation signals via a pin bar.

So if you hear somebody talking about that, you know where they are in terms of their level of trading.

They’re still a beginning trader themselves, and if you think about it, if somebody is talking about an A++ setup or they’re saying “hey, we’re waiting for a pin bar from resistance for confirmation“, besides the fact that I would suggest running from them as far as possible, because they’re still beginning traders.

You have to ask yourself “look, if you’re only willing to wait for a pin bar or an inside bar, or a false break, if you’re only willing to wait for those signals before you enter the market, well then you really don’t trust price action, do you?”

You don’t trust trends, you don’t trust price action context, impulsive vs. corrective, volatile vs. non-volatile trends, you don’t trust support and resistance, you don’t trust your own ability to trade.

You have to wait for all these other things to be in place and then this one final supposedly magical pattern and supposedly there’s only like 3 of them, which is amazing to me that this idea is actually out there, that there’s only 3 possible ways that the market is telling you a trend’s going to continue.

I don’t know about you but that seems kind of absurd to me. It seems a little insane to think that a market that is so complex, across so many players, across trends that continue.

Confirmation via a pinbar is an illusion, it’s a beginning way to look at trading.

So, your job as a professional trader… you know you’ve kinda crossed the Rubicon and made a big leap in your trading when you look at trading in terms of probabilities, not confirmation in the ordinary sense.

Confirmation, the way it’s normally talked about is a very dubious notion. It’s a very slippery idea that doesn’t really exist in the way you think it does.

If you’re constantly looking for those things you’re going to miss thousands and thousands of pips in a trend that is already well-esablished.

If you’re looking for confirmation, you won’t be able to make this trade and this trade and this trade and this trade. And that’s… what is that? +240-250 pips?

In a period of, what, 3 days? On one pair? You won’t be able to do that.”

This is part 1 of a 4 part series. Read the next one here: The Blind Entry (How It Will Leave You Trading Blind)

Have you been trading price action via ‘confirmation’? If so, I want to hear from you and what you see as the difference, so please make sure to comment below.

Was this article helpful? Please make sure to like, share and tweet it below to anyone you think can benefit from this.

Watch as I execute a live price action trade on the USD/CHF. Currently up +143 pips, I explain my entry, stop loss placement and why I took the trade.

Here’s the transcription for the forex trading video:

“Hello traders here. Chris Capre, 2ndSkiesForex.com.

Today I have a live price action trade here for you on the USD/CHF where I’m going to explain my entry, my stop loss, my take profit levels and why I took the trade.

As you can see from the chart, I’m up about +143 pips roughly at this point and it matches down here in the platform. You can also see that this is a real money account.

FXCM with all their platforms whether you’re on the institutional platform, the Active Trader, or the more common retail one which is their Trading Station 2 with New York Close forex charts will always say real when it’s a real money account and it will say demo when it’s a demo account.

Moving on to the trade here, we can see it was opened about 24 hours ago, it’s about 6 4-hour candles.

I’ve been talking to my members about this in my price action course, that the 0.95/0.9525 is a key support level.

On the 20th, the bids held this area really well, you can see there was kind of a lot of absorption of the offers here and they eventually started to push back and in that process the market tried to come back a little bit but then the bids stepped in and pushed it up another leg higher.

So I was thinking that it may not come back to the 0.95 level again so I was willing to get in at 0.9529.

I don’t consider this a textbook entry as you can see, it did go to about 0.95 again, so that would’ve been the textbook entry.

So my entry wasn’t perfect by any means, but the overall trade location was solid, this range support area has held 3 times now, so this is a really good trade location.

My stop loss placement was just a few pips below the low of the lowest push below this 0.95 here. So I have at this point a 54 pip stop and being up about 142 pips gives me almost about a plus +3R, it’s about 2.6.

Now, in terms of my target, it’s at 0.9825 and that’s the most recent spike highs.

So assuming that the bulls are gonna continue to maintain this range, at a minimum they should attack about this high right here at 0.9750 which would still offer me about +4R, but I’m gunning for this one here, expecting that it’s gonna try and make an attack up here and that would give me about +5.5R.

In terms of trade management, if the price action attacks this 0.9800 handle or above here pretty aggresively, I may be open to lifting the limit and then gunning for a larger move back towards parity or maybe 0.9950, which would add a lot more profit and R onto the trade.

In terms of the stop loss management, at this point I’m likely gonna lift the stop pretty soon here, and lock in some profit soon, perhaps just under 0.96, which would be this kinda area right over here.

And that would neutralize all the risk and lock in some profit and be in a risk free trade at this point.

But that’s pretty much it in terms of my entry, stop loss, take profit location and my price action analysis behind this.

I’m simply playing the range here, it’s a medium term range structure and so I’m playing the range on both sides, with a slight bullish bias right now.

But did you find this lesson useful?

Please make sure to like, share and tweet it below, and I’d love your comments on this and what “a-ha” moments you had from this.

Also make sure to check out my website, dev2ndskies.wpengine.com, and check out all the free forex trading articles and videos there.

If you want to take your training to the next level, make sure to visit my price action course, where I teach you how to make + high R trades, just like this.

And that’s pretty much it, this is Chris Capre with dev2ndskies.wpengine.com where I teach you how to change the way you think, trade and perform.”

In this video I show two live price action setups where I am using the pyramiding trading strategy to trade with the trend, maximizing profit.
You can learn more about pyramiding into trading positions in my price action course where I use these exact same strategies to trade the market each day.

In this video I share two live trade setups using a pyramiding trading strategy. The goal of pyramiding into trades is to maximize profits when trading with the trend, adding onto positions at key points thus compounding profits and +R.

Here’s the transcription for this Pyramiding Trading Strategy video:

“Hello traders here, Chris Capre, 2ndSkiesForex.com.

Got another live price action trade setup on the dollar yen this time, actually got two trades, so I’ve added on to my positions.

I’m going to explain the price action analysis behind why I got in this trade, what level I bought at, why I bought here, where my stop loss was, how I’ve adjusted the first position, why I got in the second position, and my targets.

So let’s get into this.

Right here as you can see, this is my first entry on the trade, so we’re still in a bowl trend right now, so I’m, because the trend is volatile, I’m looking to buy on pullbacks, if it was a non-volatile or highly imbalanced trend, then I would be looking to trade shell pullbacks or breakouts.

But this is not, we’re in a volatile trend, so I’m looking for pullbacks to prior resistance levels, turn support, or role reversal levels.

So after forming a prior swing high here, we broke above it, stopped at about 115.50, pulled back to 114.10 roughly, went right back to the same resistance, sold back off, and then started to slow down.

The selling just sort of slowed down, you can see all these wicks here, suggesting buyers are willing to step in just above the level.

Eventually, they got to the level, so I got in on the level, I didn’t wait for the candle to complete itself, I wasn’t trading a pattern, I wasn’t trading any sort of one or two **or** pattern, or anything like that.

I bought on the level because that’s where I felt that the buyers were going to come back into the market, and they ended up doing that, they went a little bit past this here.

My original stop was right about here, it was about 46 pips below, so I got in at 114.09, my stop was at 113.63, so 46 pips, and since the market took out the prior double top and highs and went past that, then after that I adjusted my stop below here on this position.

So, why did I choose to put my position or my stop-loss on my first position right here? So, my current stop-loss is at 114.61, which is 52 pips, so, +1R is locked in.

Why did I use that location? Well, strong buying interest emerged shortly after the level here, and, you know, bought it for 6 or 5, or 6 2R, 6 2R candles in a row, so 12 hours in a row.

Impulsive buying, followed by a corrected pullback, followed by more impulsive buying. so, if you look at this leg here, compared to this one, this one’s sharper, which means that either the current bowls added on to their positions on a pullback, or new players came in to help push this thing higher.

My guess is the latter, newer players came in, adding to the positions that were long, and so, if a fair amount of new players came in and added on to their positions here, ahead of resistance, with the intention of taking it out, then I suspect that any pullbacks towards here, would be defended.

So I put mine just below this here and literally a pip below this, at +1R right now.

Now, the prior resistance here, which can be considered to be here to here, acted as support initially, the pair bounced off of 15, 115, re-attacked 116, then sold off, but then it’s kind of slowed down again a bit here, and so if we look at say, the 15 minute chart here, we can see, you know, the market was slowing down into it, some buyers were trying to push this thing back up.

It broke below 115 and made a new intraday in low, but then immediate buying ensued after that, and that didn’t really make sense to me, or it does, in the sense of if the bears are really in control, they would have been able to keep pressing and pushing lower, but they didn’t.

Bulls stepped in, so I’m guessing this was some sort of stop flush, maybe people bought at 115, and so, they bought up, market pulls back to 115 and then the buyers come in really strong and earnest and push back up again another, what, hour and a half of straight buying.

I bought once we got back up above this level, and so I got in at 115.19, and so I’m currently up 44 pips on that one, adding on to the position.

Since then, the market has held above this former resistance, now support, and so it’s going to retest the bears at 116.

Because it’s been in a large range and it continues to find buying interest, I think it’s going to make a decent challenge here, if it clears it, then I’ll start adjusting the stops to lock in more profit.

So, I have essentially added on to this position, because I expect the market to continue moving. The stop loss on the second position is just below the intraday low, and so right now, the stop is, the entry is at 1519 and the stop is at, it should show me here, the stop is at 114.87.

I literally have about a 32, roughly, 32 pip stop, so I’m up +1R on that one there.

The other position is up over +3R, so about +4R right now, and again, once we take out 116, then I’ll start adjusting the stops a little bit higher, I’ll definitely lock in some profit on the second position.

In fact, if it holds above 116 nicely, and correctively pulls back to it, then I may add on to another position here, expecting this market to continue to move.

Now in terms of where my targets are, zooming out to the weekly chart, my first target is actually the higher position, the second position that I added on to.

So, that target is right here, just under 120, I’m suspecting it may run into some resistance, just a little bit short of it, maybe 118.50, 119, but barring that it can clear 117.73, which was resistance over here, and some over here.

Then from here, I’m expecting it to make it up to at least towards 118.50, 119, and then probably run into some seller, maybe some auction players who will protect 120, so I’ll take profit just before that there.

The second position, if the market should break 120, and then they get past 121 and a half, then I’m going to expect it to challenge this peak here at 123.40, roughly. So that’s back from 2007, and so at that point, then I expect some major sellers to come back in, or at least some heavy profit taking.

So, if you look and do the math of that, going back to the two hour chart, so the first position I got in at 114.09 and that had a 46 pip stop. The final target on that one is 123.21, so we’re talking a 912 pip target, with a 46 pip stop loss, that’s a 19.8R. Will it get there in a straight line?

Possibly, possibly not. It may, the market may start to reverse here, collapse below these lows, and then trigger my stop at 1R, that’s a possibility. But, if it can take out 116, and as the market progresses, I’ll trail on, continue to lock in profit and take advantage of it. If it doesn’t, then I want to be out of the trade.

The second position up here, had a 32 pip stop, and with a target at 1990, has a 471 pip target, so we’re talking a +14.7R on that one there.

So, all in all about a +33R available on this one there, 34R, but that’s if it makes it all the way up, that could take some time, and maybe it won’t, maybe the market won’t go that far, maybe it’ll stop here, maybe it’ll stop at 117.70.

Again, my intention is to capture as much of this as I can, and add on positions when it looks appropriate, when the price action is supported of it, and if the market kicks me out, on my trailing stops, then so be it.

I’m already up at this point, you know, +3, 4R between the two positions, if the first one gets stopped out for -1R, I still have at least a couple R locked in on the second one there.

So, I hope you enjoyed this video, this price action commentary, the analysis behind it. One last point I do want to make about this here is, this trade right here, so, with the 32 point stop, the high on the day was 115.72, so I was already up about plus 60 pips on this one here.

Remember that thing I said in the last video? That you shouldn’t have to wait, more than a day to get +2R? Well this one thing puts 2R within a very short period of time.

Again, if it’s taking you days, and days, and days, and days, maybe weeks or holding a week to hit +2R, then your entries are inaccurate, and your stop loss isn’t precise enough, and you have 2R to take profits or inefficient to take profits.

There’s no reason why you should have wait days on end for +2R, it happened every single day. This one did in about 23, 24 hours, this one did it inside a day.

So, I hope you enjoyed this. Please subscribe to the channel, comment anything below, check out our price action course at dev2ndskies.wpengine.com.

These are the same strategies I teach, and if you would like to learn how to make trades like this, then feel free to join the course and learn these same methods. So I will bid you all adieu. Good luck trading everyone!”

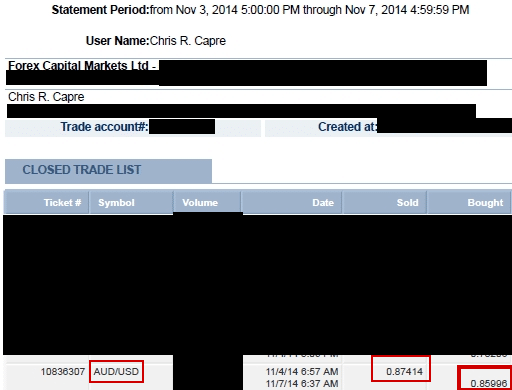
Here is a live price action trade setup I took on the AUDUSD which ended up with a net profit of +142 pips.
I’ve also attached a screenshot of the broker trade report demonstrating this was a live trade and what the net profit was as I didn’t get a screenshot before the green arrows went away.
screenshot broker statement live price action trade +142 pips profit audusd

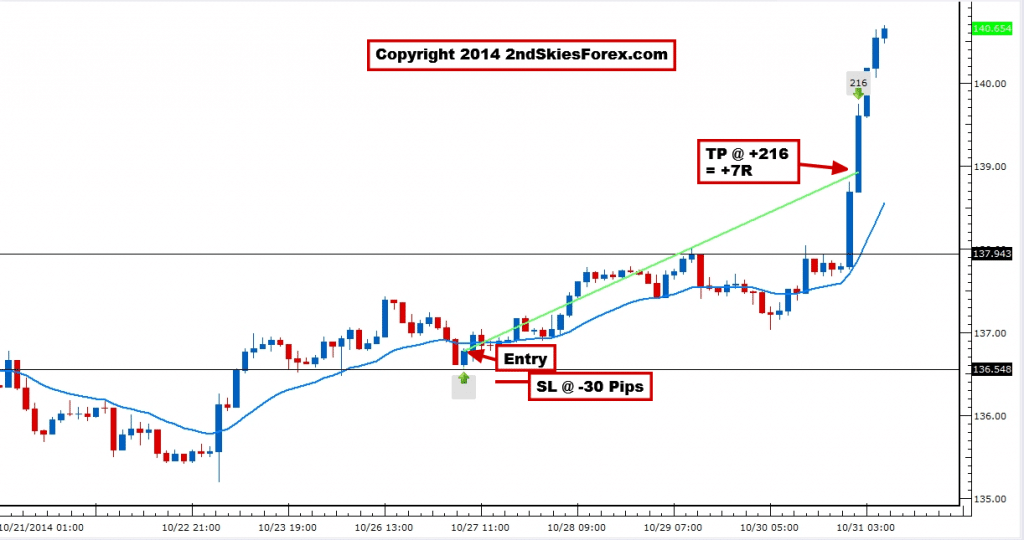
Here is a live price action trade setup I made on the EURJPY, using only a 30 pip stop and a +216 pip target. The trade profited +7R, with the final trade result and screenshot below.

eurjpy 2hr chart live price action trade oct 31 2014 v1

Enjoy this EUR JPY forex trade video and want to make trades like this? Join my Price Action Course where you can get access to my daily trade setups commentary, live trade setups forum, private member webinars, and more.

Here is a video of a live price action trade setup on the Dow Jones showing my entry, SL and TP. This trade ended up profiting +7R after holding the entry level perfectly.
Watch the video for  a detailed description of the price action context, along with my strategy for taking the trade, SL and TP placement.
Want to make trades like this? Click here to become a member of my Adv. Price Action Course.

Having trouble building your skill set for finding key support & resistance levels? Then you’ll need to train in finding them. The key lies is first identifying the price action context. Once you have this is in place, then you know what levels to look for.
In the beginning, we talk about one type of trend (volatile trends), and how to identify them. Then we discuss using this type of trend to determine what levels to find. We end by showing  how you can use Forex Tester 2 to help build your skill set in finding key support & resistance levels.
For those wanting to get the $50 discount, you can get this and order by clicking on the link Forex Tester 2 $50 Discount

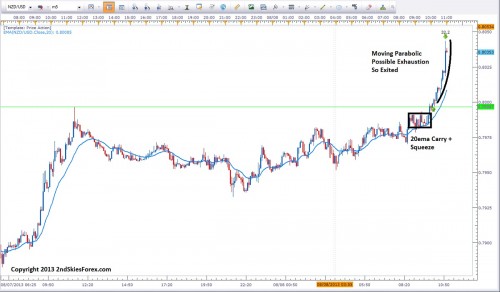
Video of a live price action trade I recently took on the NZDUSD using intraday price action trading analysis on the 5m chart.

live price action breakout trading nzdusd chris capre 2ndskiesforex

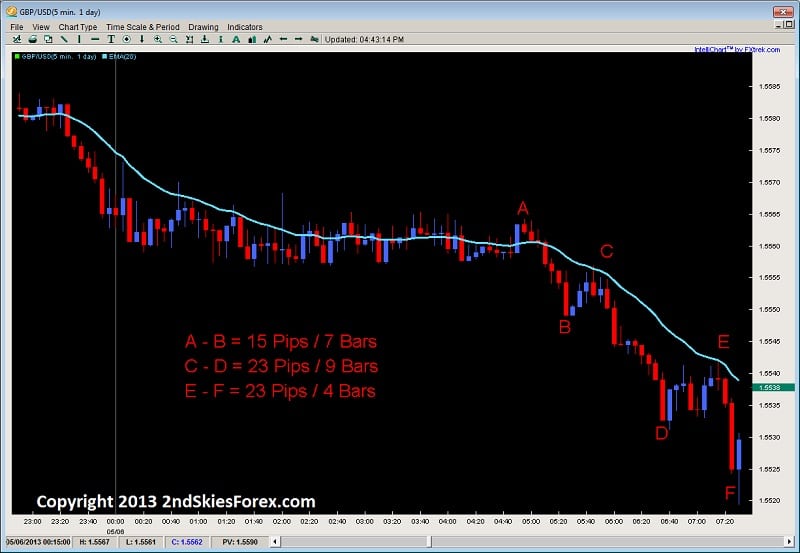
In this forex order flow video I discuss how to read the price action, order flow and the transitions behind trends or reversals.

price action, order flow and transitions dev2ndskies.wpengine.com