Chris Capre’s current live open price action & ichimoku trades: AUDNZD, CORN, WTI, USDCHF, USDMXN

New to Forex? Then check out my FREE Learn Forex Trading Course with videos, quizzes and downloadable resources

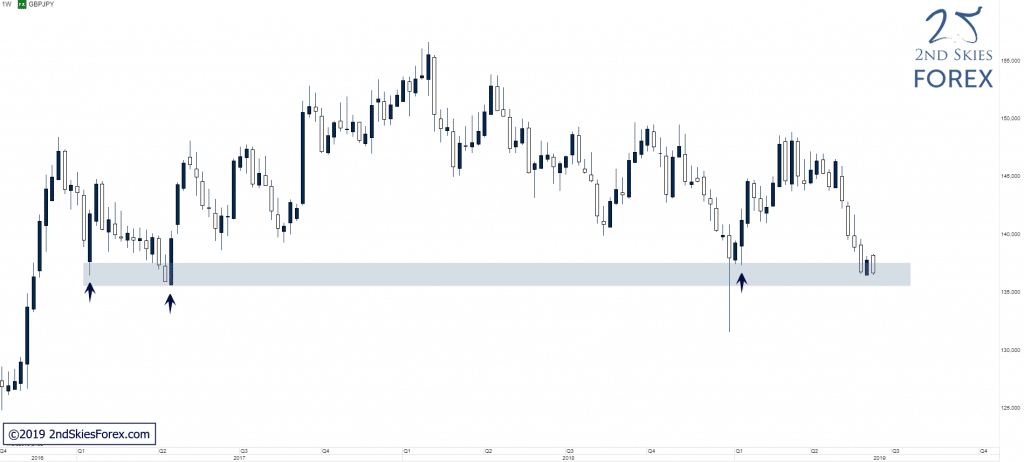
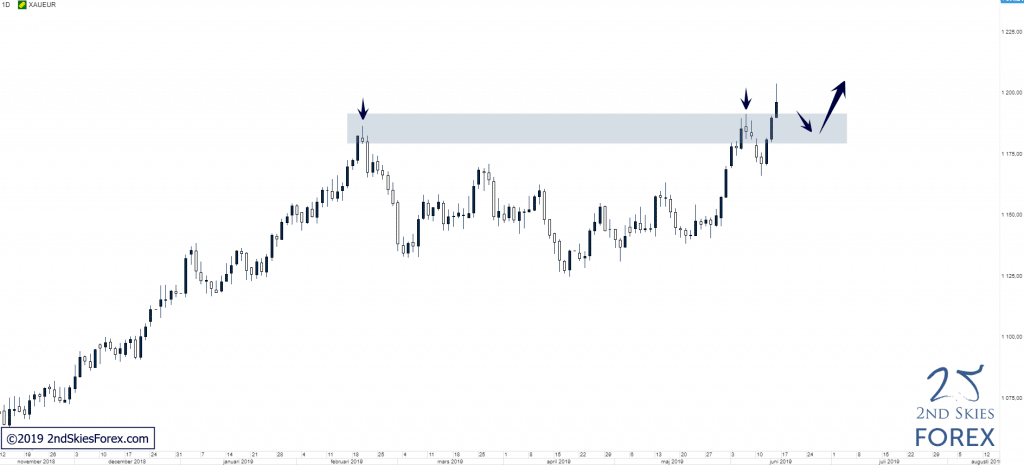
Want to find unique trading opportunities? Check out my latest trading video on how to find dynamic support & resistance.

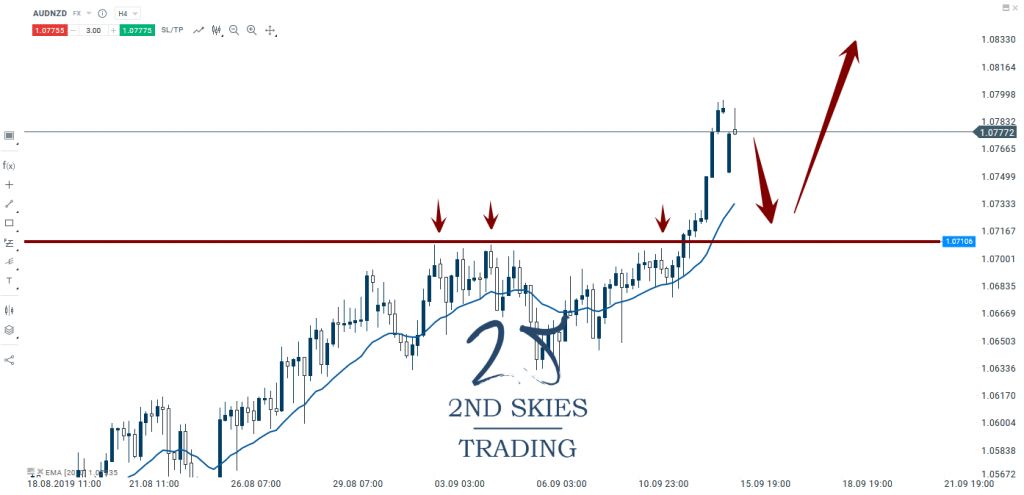
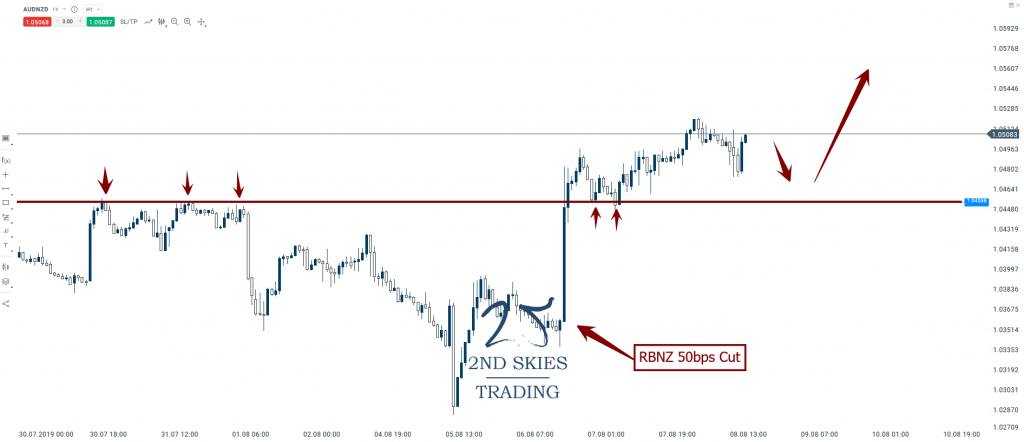
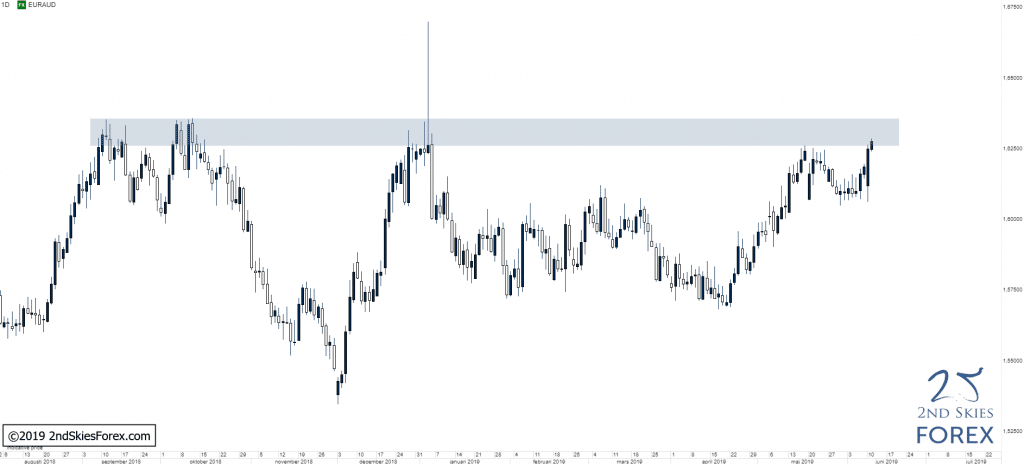
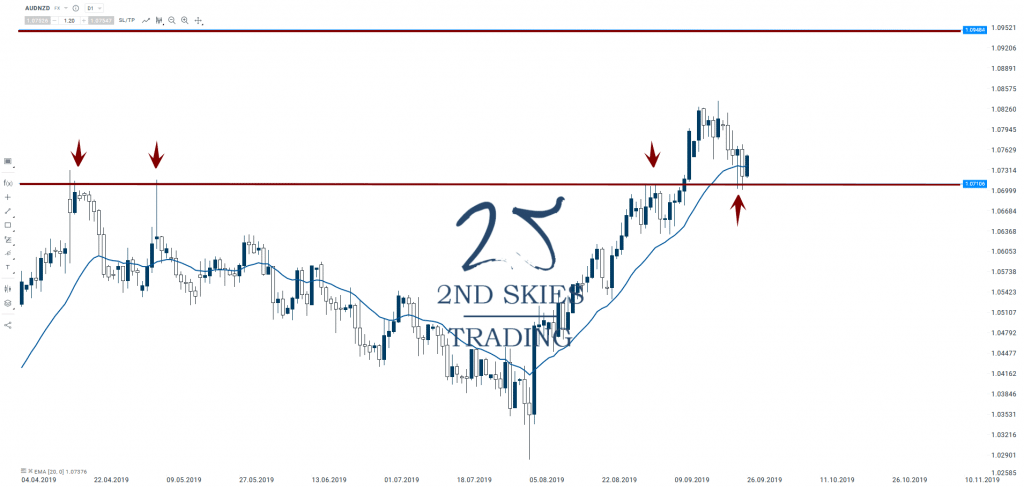
AUDNZD – Sitting On Top of Role Reversal Level (daily chart)

Price Action Context

The overall price action context on the AUDNZD has been bullish since the RBNZ rate cut. The forex pair recently broke through a key role reversal level around 1.0710 creating a great breakout pullback setup. ST bulls can watch this area for potential support. As long as this holds, the line of least resistance is up.

audnzd role reversal level

Trending Analysis

ST bullish while above 1.0710. MT bullish while above 1.0475.

Key Support & Resistance Levels

R: 1.0825, 1.0948

S: 1.0710, 1.0475

Stay tuned to the members market commentary for updates.

******

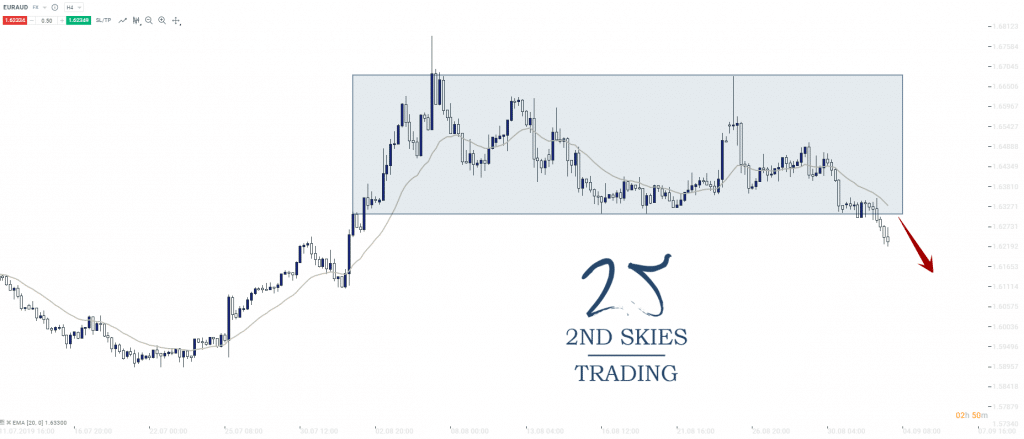
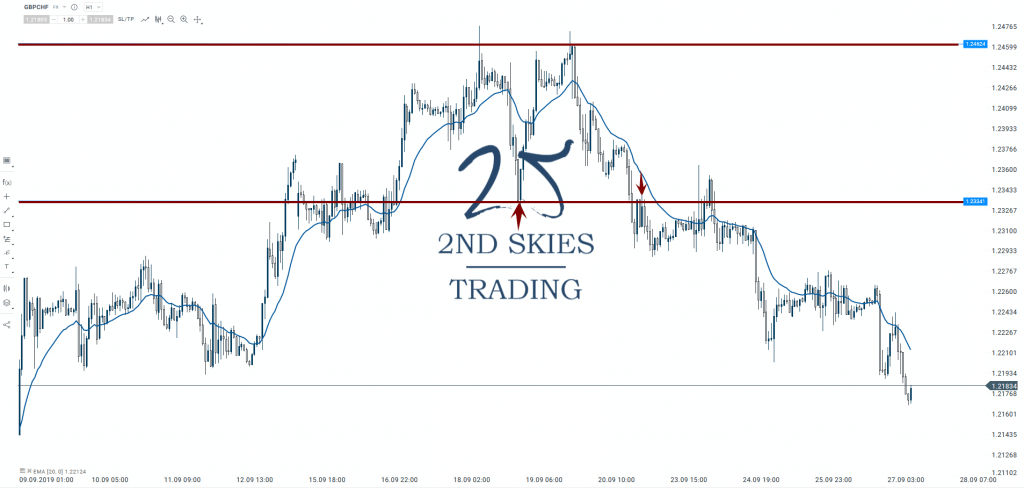
GBPCHF – Short Trade Idea on Break of CS Profits (1hr chart)

Price Action Context

In our recent market commentary, we talked about the ST corrective structure on the GBPCHF and intimated the bulls would start unwinding their longs and put bearish pressure on the pair.

We also suggested a break of the ST support level around 1.2334 would create a selling opportunity. As you can see from the chart below, this is exactly what happened.

Congrats to the members who profited from this trade setup.

gbpchf corrective structure 2ndskiesforex

Trending Analysis

ST & MT bearish while below 1.2334 on a weekly closing basis.

Key Support & Resistance Levels

R: 1.2334, 1.2260

S: 1.2184, 1.2012

******

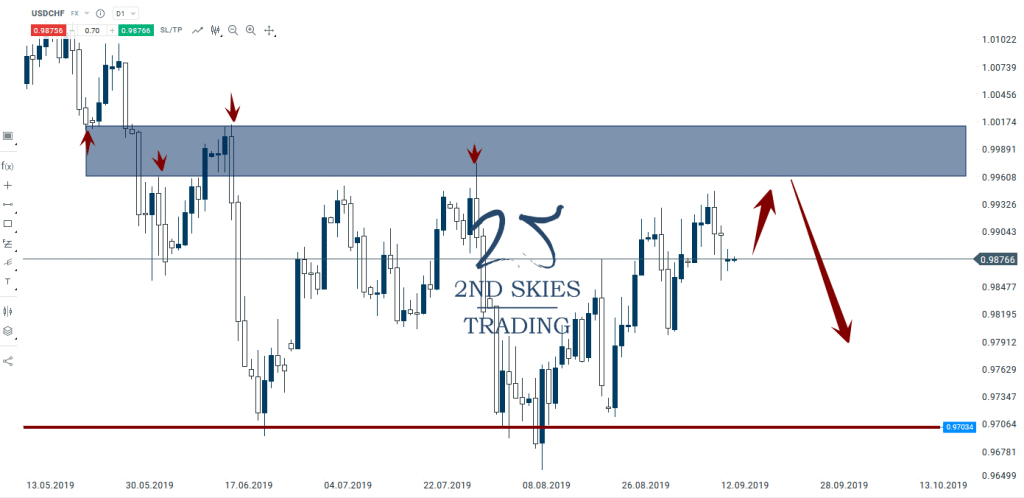
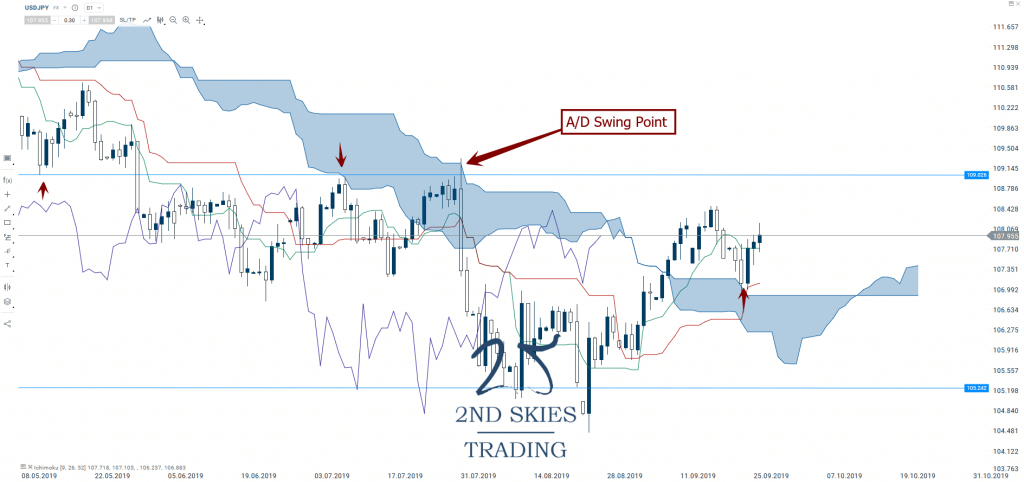
USDJPY – ST Bullish Ichimoku Structure, But MT Bearish (daily chart)

Ichimoku Context

ST the ichimoku structure on the USDJPY pair is bullish as the pair is currently above the daily kumo, and had recently pulled back to the flat bottom and bounced solidly.

usdjpy ichimoku trading 2ndskiesforex

Trending Analysis

ST bullish while above the daily kumo on a closing basis. MT still bearish while below the A or D swing point around 109.02

Key Support & Resistance Levels 

R: 109.02, 110.57

S: 107.03, 105.24

Chris Capre’s current live open price action & ichimoku trades: AUDNZD, CORN

New to Forex? Then check out my FREE Learn Forex Trading Course with videos, quizzes and downloadable resources

Want to learn how to trade breakouts profitably? Check out my latest trading video where I share my favorite pattern for trading breakouts.

AUDNZD – Breaks MT Resistance, Bullish ST (4hr chart)

Price Action Context

Continually gaining ground since the RBNZ rate cut, the AUDNZD has broken above a key MT resistance levels around 1.0710. Notice the breakout pattern which we recently did a video on, and how well that played out for a profitable trade setup?

audnzd breakout pattern 2ndskiesforex

Trending Analysis

ST I’m bullish while above 1.0710 on a daily closing basis. The line of least resistance seems up and am expecting a push towards 1.0948.

Key Support & Resistance Levels

R: 1.0948, 1.1121

S: 1.0710, 1.0510

Stay tuned to the members market commentary for updates.

******

USDCHF – Large Corrective Structure In Play, Looking to Sell (daily chart)

Price Action Context

For pretty much the entire summer, the USDCHF has been stuck in a large corrective structure between 1.0010 and 9700 with a few touches on each side. Traders should be looking to trade both sides of the market till it breaks.

usdchf large corrective structure

Trending Analysis

MT the corrective structure dominates while ST I’m looking to sell as we press close up to the key resistance zone.

Key Support & Resistance Levels

R: 9960, 1.0010

S:9700, 9650

******

Corn – Just Above Major Support Zone, Expecting A Bounce (daily chart)

Price Action Context

Corn has been selling off for most of the summer, but it just bounced off a major support zone between 345 and 360. I’m currently long corn and am expecting a bounce. 

corn major support zone 2ndskiesforex

Trending Analysis

ST bullish while above the major support zone but MT bearish so will need to shake off the selling pressure from the summer and clear 387 to relieve some of the downside technical pressure.

Key Support & Resistance Zones

R: 387, 414

S: 362, 343

Chris Capre’s current live open price action and ichimoku trades: Silver, NZDJPY

New to Forex? Then check out my FREE Learn Forex Trading Course with videos, quizzes and downloadable resources

Want to learn how to trade breakouts profitably? Check out my latest trading video where I share my favorite pattern for trading breakouts.

NZDCAD – ST Corrective Structure Failing, Potential Bearish Signal (1hr chart)

Price Action Context 

After gaining since the end of August this year, the NZDCAD has stalled and broken below the key support zone in a corrective structure between 8490 and 8440. 

nzdcad corrective structure forex

Trending Analysis

ST we’re bearish while below the 8490 highs and corrective structure bottom. IMO a move towards 8400 and 8350 seems the line of least resistance.

Key Support & Resistance Levels

R: 8440, 8490

S: 8400, 8350

Chris Capre’s current live open price action and ichimoku trades: Silver, NZDJPY

New to Forex? Then check out my FREE Learn Forex Trading Course with videos, quizzes and downloadable resources

Want to learn how to trade breakouts profitably? Check out my latest trading video where I share my favorite pattern for trading breakouts.

EURAUD – Medium Term Corrective Structure Breaks, Bearish While Below (4hr chart)

Price Action Context

The EURAUD has been stuck in a medium term corrective structure for all of August between 1.6327 and 1.67-ish. However recently, the pair has folded below the corrective structure support and is now testing the 1.61’s. ST this puts bearish pressure on the pair and we’ll remain short ST while below this structure.

Trending Analysis

ST bearish, MT in large range between 1.5840 and 1.67.

Key Support & Resistance Levels

R: 1.6327, 1.67

S: 1.6057, 1.59

Chris Capre’s current live open price action and ichimoku trades: USDJPY, AUDCAD, SLV, AUS200

New to Forex? Then check out my FREE Learn Forex Trading Course with videos, quizzes and downloadable resources

Did you see my live trade setup on the AUDCAD? Don’t miss how I grabbed a quick +125 pips of profit breakout trading with a near perfect entry.

AUDNZD – Big Winner vs NZD 50bps Rate Cut, Staying Long (1hr chart)

Price Action Context

While MT in a bear trend, ST the AUDNZD is a in a bull trend after bouncing off the key support near 1.0298, and then sky-rocketing after the surprise RBNZ 50bps cut. Notice the breakout pullback setup off of the prior ST highs near 1.0453 as the level held perfectly and has produced a decent bounce thus far.

audnzd-breakout-pullback-setup-2ndskiesforex

Trending Analysis

ST I’m staying bullish and am expecting a move north to pass 1.06+. Traders not already long should look for pullbacks towards support for potential buying opportunities.

Key Support & Resistance Levels

R: 1.0545, 1.0615

S: 1.0454, 1.03

Chris Capre’s current live open price action and ichimoku trades: USDJPY, AUDCAD, SLV, AUS200

New to Forex? Then check out my FREE Learn Forex Trading Course with videos, quizzes and downloadable resources

Did you see my live trade setup on the AUDCAD? Don’t miss how I grabbed a quick +125 pips of profit breakout trading with a near perfect entry.

Silver – Trying to Breakout, ST Bullish, But Needs to Clear Resistance (1hr chart)

Price Action Context

Gaining heavily over the last several weeks, Silver formed a wide corrective structure between 15.90 and 16.63 for the last month. However, the precious metal is forming a series of higher lows, putting pressure on the bears in the ST resistance zone between 16.54 and 16.64.

silver breakout trading 2ndskiesforex

Trending Analysis

For now, I’m ST and MT bullish, but I’d like to see the PM break through the short term resistance and stabilize above 16.63. If it can do that, I favor the probabilities it continue it’s ST bull run.

Key Support & Resistance Levels

R: 16.54, 16.64
S: 15.90, 15

Chris Capre’s current live open price action and ichimoku trades: USDJPY, AUDCAD, SLV, AUS200

New to Forex? Then check out my FREE Learn Forex Trading Course with videos, quizzes and downloadable resources

What is happening in the forex market? Check out my latest video on how this unique volatility environment will affect your forex trading

EURUSD – Broken Below MT Support (Daily chart)

Price Action Context

After bulls got rejected around 1.14 in the end of June sellers re-took control and EURUSD has now broken below a key support zone and produced a new lower low MT, opening up for a likely continuation lower towards 1.09 if bears are able to stay in control.

EURUSD_Broken_Below_MT_Support

Trending Analysis

Bias is bearish and the current pullback into the broken support which now should act as resistance can be of potential interest to bears looking to short the pair.

Key Support & Resistance Zones

R: 1.1100 – 1.1150

S: 1.0800 – 1.0900

Stay tuned to our members private trade setups channel for updates.

******

ASX – Testing Major Resistance & ATH (Monthly chart)

Price Action Context

Australia’s index is now testing the ATH resistance zone from the pre-financial crisis high back in 2007, something we highlighted as a possibility in our top trade ideas for 2019 video.

ASX_Testing_Major_Resistance__ATH

Trending Analysis

LT bias is bullish, but considering the significance of this ATH, at a minimum, a solid bearish ST rejection from this key resistance is very likely IMO, which can present potential shorting opportunities to bears. A LT break and close above 6880 would open up further upside for the index.

Key Support & Resistance Zones

R: 6780 – 6880

S: 6330 – 6450

You can trade the ASX200 index via our preferred trading broker here.

******

XAUUSD – MT With-Trend Corrective Structure Above LT Key Support (4h chart)

Price Action Context

Mid-June, the precious metal successfully cleared the multi-year resistance we’ve mentioned in our recent member market commentaries, opening up further upside. Since, price has produced a MT with-trend corrective structure which for now seems to be holding.

XAUUSD_MT_Corrective_Structure_Above_LT_Key_Support

Trending Analysis

LT bias is bullish and bulls can look for potential trading locations on pullbacks towards the CS bottom and LT key support.

Key Support & Resistance Zones

R: 1 437 – 1 453

S: 1 360 – 1 392 (LT Support)

You can trade spot gold via our preferred trading broker here.

Chris Capre’s current live open price action and ichimoku trades: USDMXN, VIX, CAMP, EA

New to Forex? Then check out my FREE Learn Forex Trading Course with videos, quizzes and downloadable resources

Want to learn how to draw support and resistance? Check out my latest video How To Draw Support & Resistance (5 Tips)

EURGBP – Running Into Major Resistance (Weekly chart)

Price Action Context

After a failed bearish continuation + false break back above LT support in May, the strong MT bull run that followed has taken the pair all the way back up to a major LT resistance that has held since Q3 2017.

EURGBP_-_Running_Into_Major_Resistance

Trending Analysis

Overall neutral bias with the LT resistance offering potential bearish plays with 0.8710 being the closest LT support to look out for. A break above 0.9100 would technically open up for a continuation towards 0.9300.

Key Support & Resistance Zones

R: 0.9000 – 0.9100

S: 0.8620 – 0.8710

Stay tuned to our members market commentary for updates.

******

GBPUSD – Attempting To Break Key Support (Daily chart)

Price Action Context

After being rejected twice from 1.3300 in Feb/Mar, price sold off towards the lows created in 2016/2017. Bulls seem to be absent and unless they step in soon, it’s like this key support zone will fail to hold IMO as price action is looking very weak atm.

GBPUSD_Attempting_To_Break_Key_Support

Trending Analysis

LT bias is bearish and a strong break and close below this key support level opens up for a likely bearish continuation towards the 2016/2017 lows and can offer potential short plays for bears.

Key Support & Resistance Zones

R: 1.3300 – 1.3385

S: 1.2400 – 1.2485

******

XPTUSD – Back @ LT Key Resistance (Weekly chart)

Price Action Context

After reversing a bit shy of the LT support zone, Platinum is now back at the LT resistance which has rejected price multiple times since mid-2018.

XPTUSD_Back__LT_Key_Resistance

Trending Analysis

LT bias is bearish and if bears successfully can defend this zone a move back down towards the LT support is likely. A strong break and close above this zone on the other hand would put 1 010 back into focus.

Key Support & Resistance Zones

R: 870 – 915 S: 754 – 777

Chris Capre’s live open price action and ichimoku trades: GBPUSD, NZDJPY, USDJPY, USDNOK, CAC40, VIX

New to Forex? Then check out my FREE Learn Forex Trading Course with videos, quizzes and downloadable resources

How Much Should You Risk Per Trade? Watch our latest video How Much Should You Risk Per Trade {3 Rules}

GBPJPY – Testing Multi-Year Support (Weekly chart)

Price Action Context

After breaking below 140.00, the strong selling continued and the pair is now testing a multi-year support zone at which I think at least a solid ST bounce is likely considering the significance of this support zone.

forex-gbpjpy-key-support-2ndskies

Trending Analysis

If bulls are able to successfully defend this key support, a move back up towards 140 is likely IMO and should 140 fail to stop price, 148 would be the next key resistance to look out for. A failure of this support on the other hand would open up a solid amount of downside with 130 being the first support in line to look out for.

Key Support & Resistance Zones

R: 138.60 – 140.00
S: 135.50 – 137.50


******

XAUEUR – Broken Above Key Resistance, Potential False Break (Daily chart)

Price Action Context

After a brief rejection at the KSP from February, the precious metal found support at 1 170 and impulsively broke above 1 190, producing a solid bullish close above the resistance.

gold-vs-euro-bullish-trend-2ndskiesforex

Trending Analysis

LT bias is bullish and weak pullbacks towards the broken resistance can present potential buying opportunities. A break and close back below 1 180 would render this a CT FB and initially open up for a move back down to 1 135.

Key Support & Resistance Zones

R: 1 215 – 1 225
S: 1 180 – 1 190

******

DAX – Holding Above ST RRL (1h chart)

Price Action Context

After putting in a WT false break at 11 850, which we talked about in our commentary on the 8th of June, price continued trading higher and is currently holding above a ST RRL.

dax-trade-signal-2ndskiesforex

Trending Analysis

LT bullish bias and bulls can look for possible buying opportunities around the ST support level. A break below this ST support would open up for a move lower back into 11 850 which in turn also could present potential buying opportunities IMO.

Key Support & Resistance Zones

R: 12 173 – 12 225
S: 12 045 – 12 080

Chris Capre’s live open price action and ichimoku trades: GBPUSD, NZDJPY, USDJPY, USDNOK, CAC40, VIX

New to Forex? Then check out my FREE Learn Forex Trading Course with videos, quizzes and downloadable resources

What is our preferred web based trading platform? Check out our latest platform review on the xStation 5.

EURAUD – Major Resistance Zone Ahead. Selling Opportunity? (Daily Chart)

Price Action Context

LT we’re in a big range between 1.53 and 1.63. The lows are building over the last 2 round trips to the key resistance zone ~ 1.6250 and 1.6350. There is also the spike high from Dec. last year which goes up towards 1.67.

euraud-approaching-key-resistance-zone-2ndskiesforex

Trend Analysis

LT neutral while inside this large zone, ST bullish as we’re producing lower highs and continually pressuring the resistance zone above. Traders will need to watch out for a false break setup above the zone, but there are potential opportunities to be short at the zone and long above.

Key Support & Resistance Levels

R: 1.6250 – 1.6350, 1.67

S: 1.61 – 1.565