Tag Archive for: forex

What’s Inside?

  • What is the xStation5 platform?
  • What are the key features of this forex and multi-asset class trading platform?
  • How does the charting, feature and technical analysis of the xStation5 compare to other platforms?

xStation 5 Platform Intro

Late last year, I was starting the process of looking for a new broker and platform to trade with. While I’ve been trading with SaxoBank’s platform (SaxoTrader Go & SaxoTrader Pro) during the last 3 years, I felt there were certain features that were missing which (IMO) were necessary for my trading operations.

I eventually stumbled upon the xStation 5 platform, and from the first few moments of using it, I realized it was one of the best platforms I have worked with over the years.

When I’m trading on any platform, there are two main areas I am evaluating every platform on. They are:

  1. Functionality – does the platform offer the functions/functionality I need to perform my trading operations on a daily basis? This could range from the simple aspects of trading/execution, to charting to analysis/statistics on my performance, etc.
  2. UX (User Experience) – what is the user experience when I start working with the charts? Are they intuitive/easy to use? Or are they bulky and confusing? Do I have to do several clicks for a simple operation that should/could be done in 1 click? And is it easy to switch from task to task?

If the above two criteria are met with my requirements for any trading platform, then I engage in a further process of experimentation and discovery with the platform using it for several months before I park my money with any broker.

I don’t want to be learning how to drive a sports car on the race track. The same goes for trading.

After working with the xStation 5 platform, I can honestly say this is a platform I’d want to trade $1MM+ of funds with and feel it can satisfy 99% of everything I’d need/want to do with trading.

FYI, the platform is available in many languages, such as:

English
Polish
Czech
German
Spanish
French
Hungarian
Italian
Portuguese
Romanian
Slovenian
Turkish
Chinese
Japanese

And you can trade the following instruments/asset classes on the xStation 5 platform:

Forex
Global Indices
Commodities
Stock CFD’s
ETF CFD’s
Crypto Currencies

xStation 5 Platform UX/Functionality

Now that I’ve shared my personal take on using the xStation 5 platform over the last 6 months, it’s time to get into the UX, functionality, along with the pros/cons of it.

The xStation 5 platform is a web based trading platform, which IMO is where platform technology is moving.

This is the xStation 5 platform when you login.
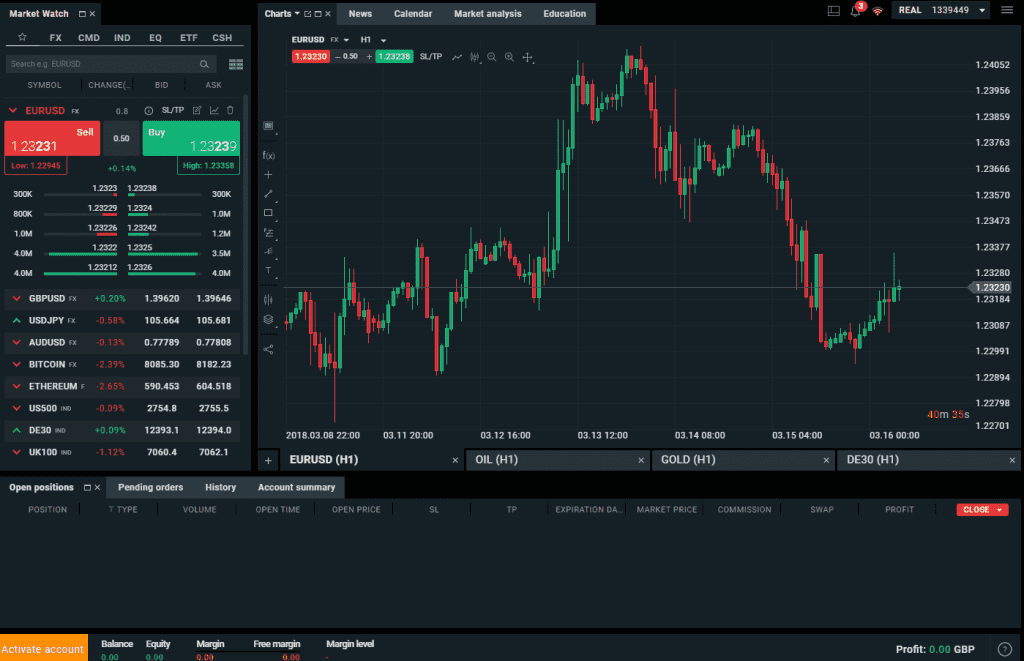
xstation-5-base-platform-image-2

From the moment I opened the xStation 5 platform, I was super impressed by how easy it was to use and navigate. I didn’t watch a single video, nor read one tutorial on how to use it, yet I was able to do 90+% of everything I wanted to within minutes.

The main color themes it comes in are black and white (I prefer white).

Below is what they call the ‘Market Watch‘ screen which is one of the ways you can place a trade.
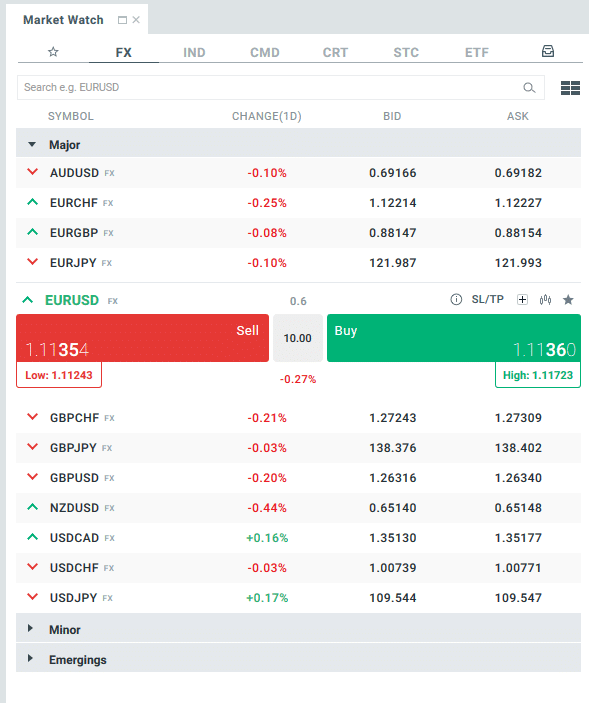
xstation-market-watch

It is fully customizable by instrument and asset class which you can seamlessly change through. You can also search directly in this market watch section for any of the 2000 instruments available.

I also like how they group the different sub-categories within each asset class. So for trading forex pairs, they have it broken down into major forex pairs, minors, and EM (emerging market) pairs.

Stock traders will also love this as they have the stock selections separated by country (see below).
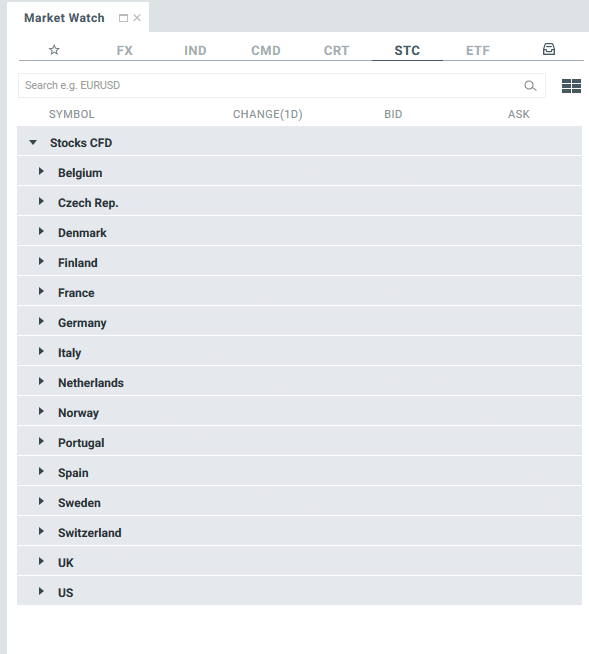
xstation-stock-market-watch

The easiest way to describe the market watch UX and functionality is simply ‘user-friendly‘.

xStation 5 Charting

Next is the charting features which are either embedded within the platform, or can be detached so you can put your charts on a separate monitor.

I prefer this setup because I trade with several monitors (3) and like to have my platform on one monitor, and my charting on another.

You can open several tabs/charts which can be viewed individually (full screen) like the one below:
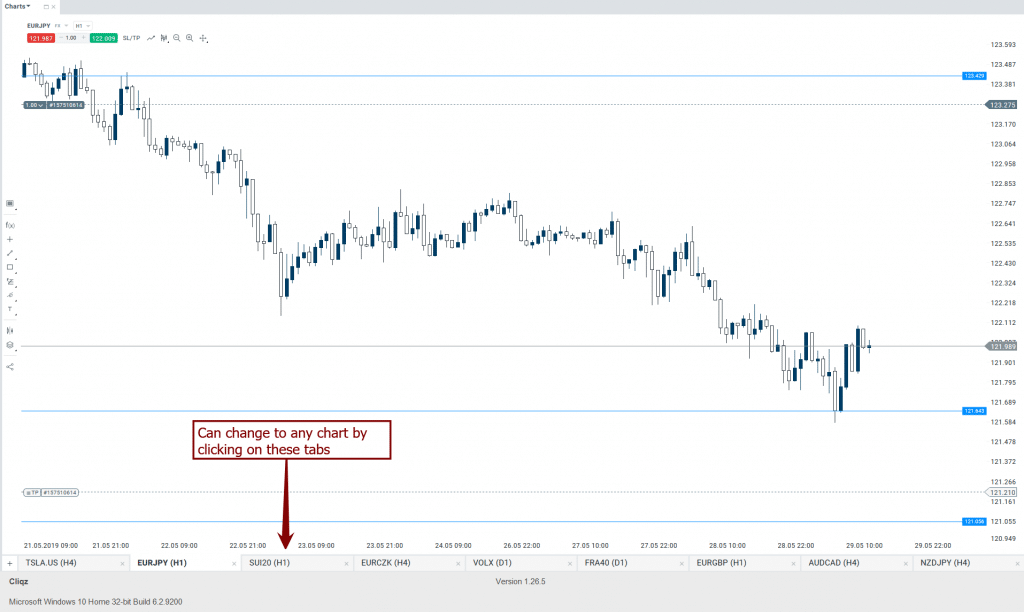
xstation-individual-chart

…or have them in a grid of your choosing.
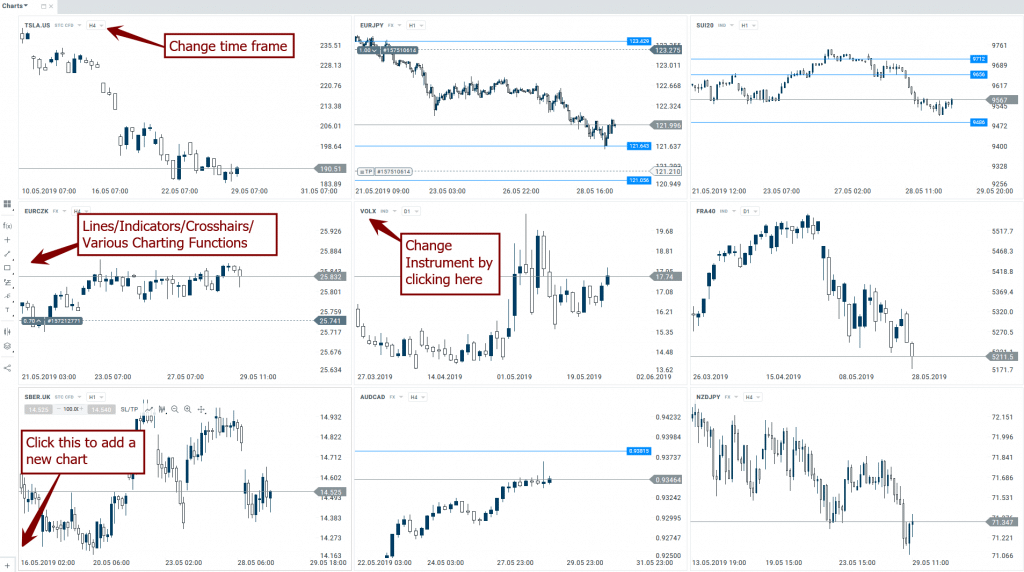
xstation-grid-chart-image

Do you noticed that ‘+‘ sign in the bottom left of the chart? That is what you click on to add a chart.

The charts are flexible, customizable and easy to learn. Any newcomer to the xStation platform should be able to figure out most charting operations within minutes.

I won’t go into all the charting features available, but by and large, I’ve yet to see a chart feature I need on a day to day basis that this platform doesn’t offer.

Open Positions & Pending Orders

Your open positions tab is pretty straight forward and customizable so you can add/delete certain data points at your discretion.

xstation open-positions-tab

NOTE: Those are a couple of my open trades. You’ll notice both are in profit 😉

xStation 5 News/Calendar/Analysis/Education

Rounding off some of the standard features in most platforms today are the news/calendar/analysis/education features.

They provide up to date news in the global markets so you can stay apprised of any market moving announcements or data coming out.
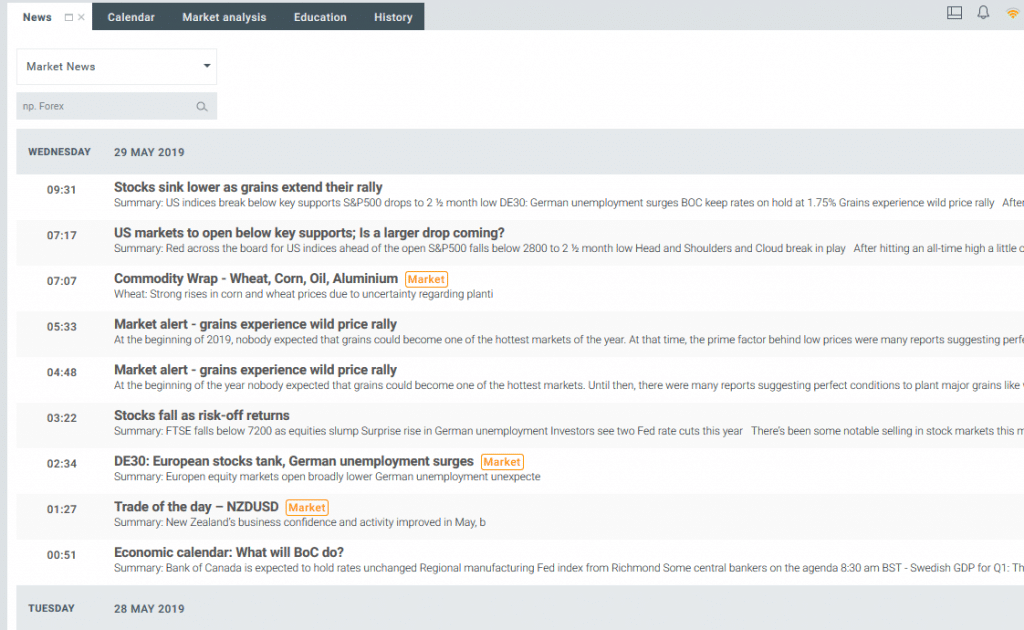
The calendar is simple, intuitive and will give you all the economic announcements per country, time, currency its most related to, along with the forecast, previous numbers and actual posted numbers.

Market Sentiment

Market Sentiment is a really interesting feature as it displays the overall open position status for all of XTB’s clients.
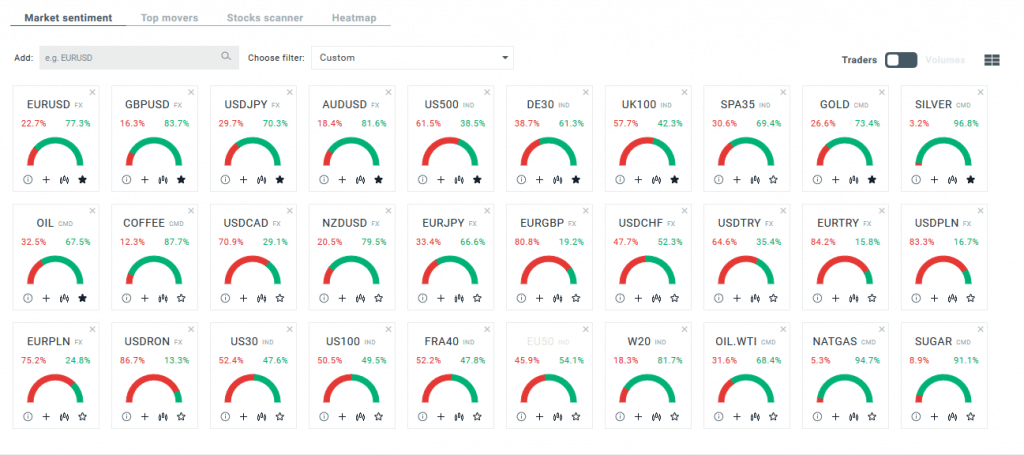
xstation-market-sentiment

Top Movers

Top Movers shows you which instruments had the biggest moves % wise per day/week/month which I find to be a very helpful feature to spot where volatility is increasing and thus providing potential trade setups.
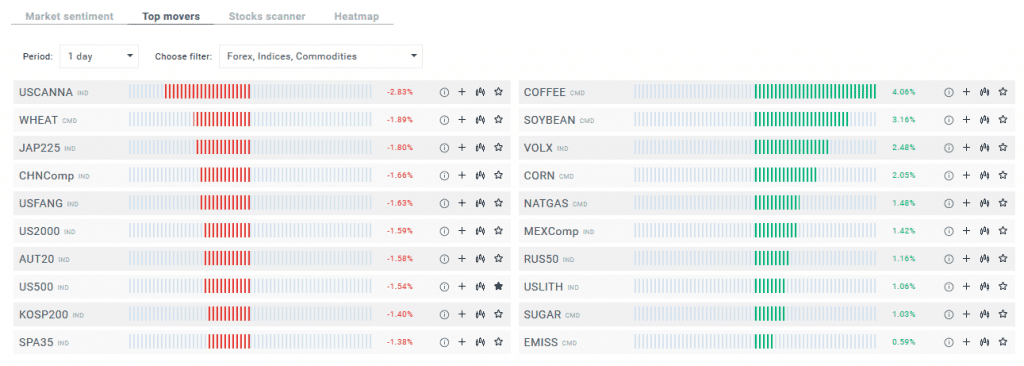
xstation-stock-trading-analysis

Stock Trading Analysis

Stock traders will love the stock scanner which shows the instruments of your choice by country/industries, and allows you to narrow down what you’re watching based upon market cap, EPS, P/E values, dividends, ROE and BETA.
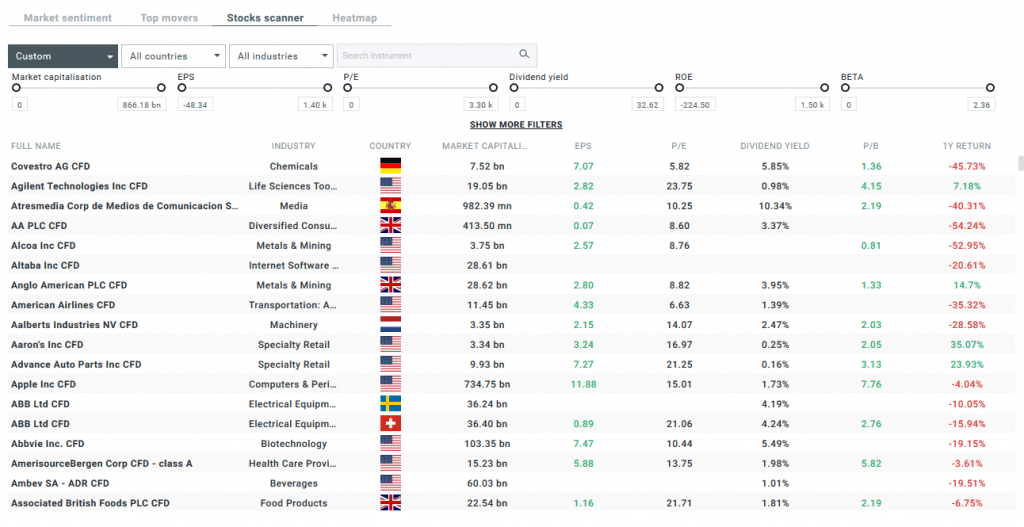
xstation-stock-scanner

The heat map is just an extension of the top movers in a different graphical form.

There is also a small amount of educational videos and a trade history showing all your closed trades. The education section is somewhat limited, but the history tab is easy to understand and you can export your data to an excel/CSV file.

Trading Statistics

Lastly, the platform offers you some trading statistics, such as:

  • Overall profit/loss
  • Broken down by instrument
  • % Accuracy (all/buy only/sell only)
  • Avg. Trade Duration
  • Avg./Max consecutive winning/losing trades
  • Avg./Max profit/loss on winning/losing trades

While I would like any platform to offer more trading statistics than this, I find it sufficient for any beginning/intermediate trader to work with.

In Summary

Overall I find the xStation 5 platform to be one of the most user-friendly platforms available today whether you are a retail or professional trader. All but the institutional trader will find this platform with one can need/use/want.

You can seamlessly navigate between the different panels which makes your every day user functions and experience feel effortless. I feel they could improve their offerings for automatic trading and back testing strategies, but the overall UX/functionality makes this platform a must try for all but the most algorithmic heavy traders.
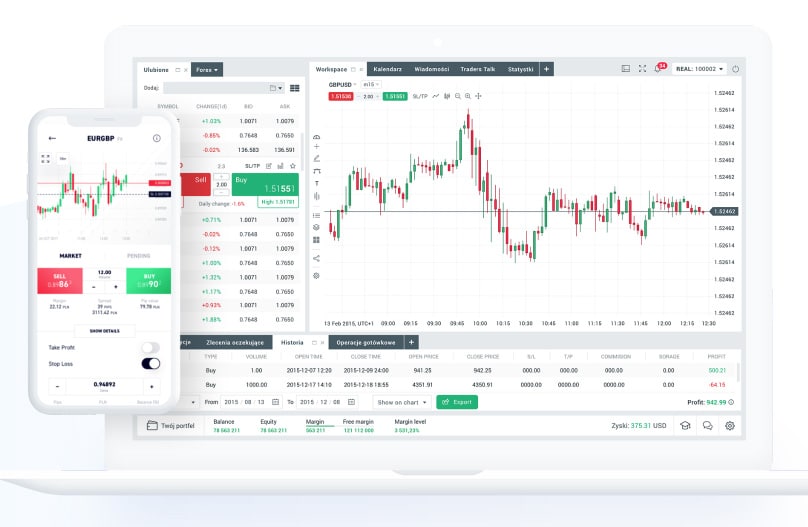
Hence if you haven’t tried the xStation 5 platform, I’d highly recommend you give it a go and see what your experience is using it. Compared to MT4/5, I find this to be a superior platform for everyone but algo/EA traders.

If you’d like to sign up for a free demo account, you can click on any of the two links below:

For UK/EU Clients, click here
For Non-UK/EU Clients, click here

BONUS OFFERING: If you’d like to get my price action course for FREE, you can do so by clicking on this link to learn more about the requirements.

Full Disclosure: 2ndSkiesForex does not receive any fees/commissions/remunerations based upon your trading activity with XTB. We may receive a 1x fee for referring any new clients who open up an account with XTB and fulfill certain requirements.

With that being said, please make sure to leave a comment along with your feedback from using this platform below.

Until then – I sincerely wish you real growth and success in your trading.

Want FREE Trading Charts For Forex, Stocks or any asset class? Check out our top charting provider Trading View.

Check out my latest video How To Day Trade Stocks Using Volume

Want my Price Action Course for FREE? Click here to find out how.

Forex Trade Idea: EURMXN – Holding Dynamic Support, Potential Breakout (daily charts)

Price Action Context

As we wrote in our ‘Is the stock market going to crash?‘ article, we suggested shorting EM FX, particularly MXN, RUB & ZAR.

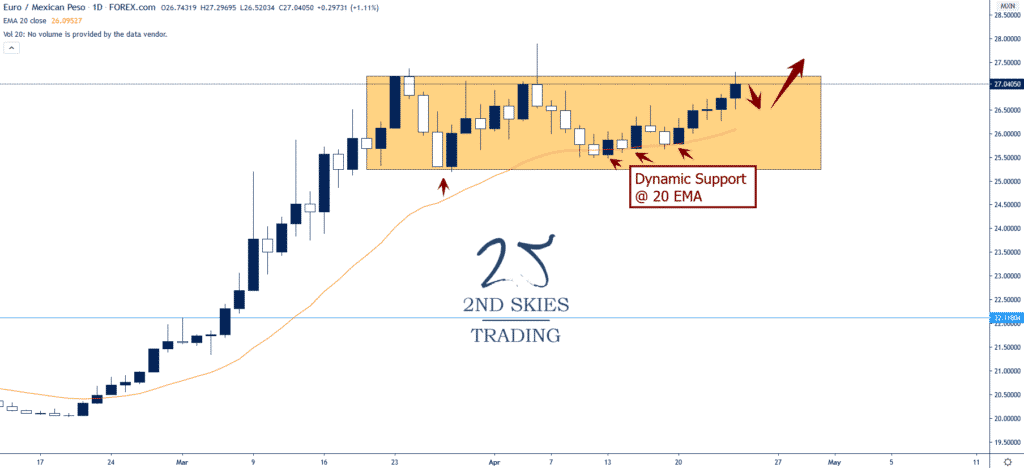
The EUR has been particularly strong against MXN and has formed a corrective structure at the top of its recent bull move (yellow box).

With pullbacks holding at dynamic support (20 EMA) and continuing to press the highs, I’m suspecting this will form a breakout setup to the upside.

eurmxn breakout setup 2ndskiestrading

Trending Analysis

ST & MT bullish while above 25.25 on a weekly closing basis. Watching for breakout setup to get long.

Key Support & Resistance Levels

R: 27.04, 27.85

S: 26.11, 25.20

Stay tuned to our members market commentary for updates.

******

ETF Trade Idea: $SPY – Some Weakening, But Still Bullish (daily chart)

Price Action Context

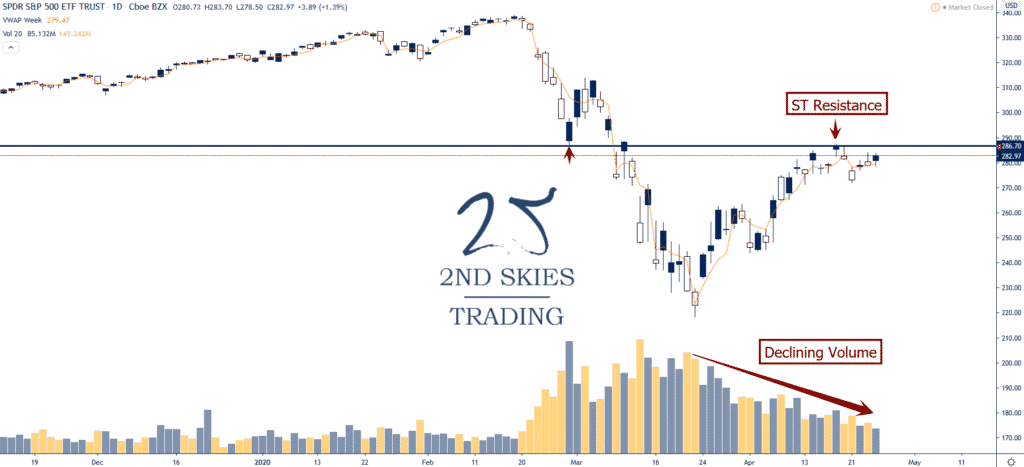
Bouncing with the overall market (on low volume of note), the $SPY (S&P ETF Index) has showed its first signs of weakening being the first week in many to not close or push above the prior weeks high.

This alone is not enough to call the top of this bounce, but its the first sign showing some weakening in the $SPY.

If we start to see more signs in the price action, then it may be slowly starting to roll over as CTA’s and momentum chasers reduce longs.

spy trade ideas 2ndskies

Trending Analysis

ST bullish but MT needs to clear 287.30 to add fresh technical momentum

Key Support & Resistance Levels

R: 287.30, 302

S: 272, 262

******

Stock Trade Idea: $SPG – Barely Holding Lows, Potential Downgrade (daily chart)

Price Action Context

Commercial real estate has been getting clobbered with foreclosures and missed rents as of late.

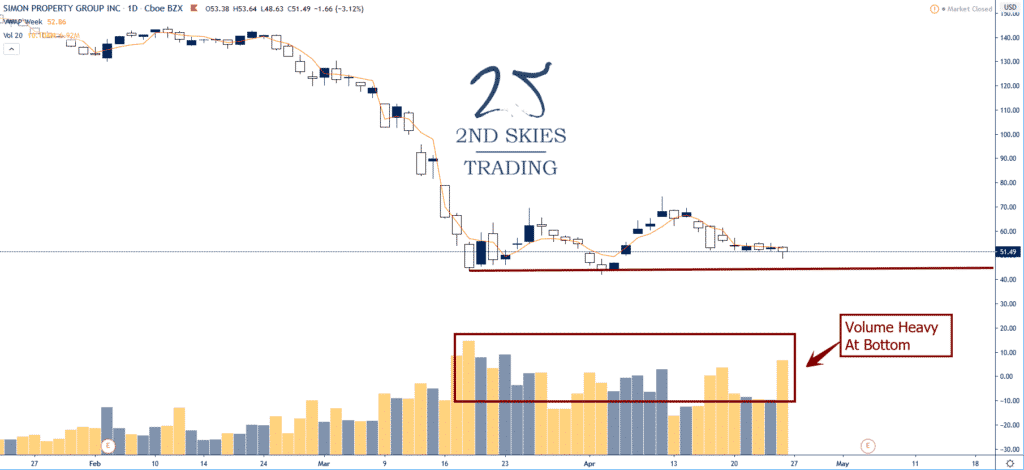
Simon Property Group ($SPG) hasn’t been spared and cannot seem to get up off the mat, barely holding above the lows while others have rebounded. 

Take that + a potential downgrade and you have a recipe for low buying interest and a potential breakdown.

spg simon property group downgrade

Trending Analysis

ST & MT bearish while below 70 on a weekly closing basis.

Key Support & Resistance Levels

R: 68.63, 73.83

S: 43.78, 40

Want FREE Trading Charts For Forex, Stocks or any asset class? Check out our top charting provider Trading View.

Check out my latest video How To Day Trade Stocks Using Volume

Want my Price Action Course for FREE? Click here to find out how.

Forex Trade Setup: AUDNZD – Looking to Sell On Rallies (weekly chart)

Price Action Context

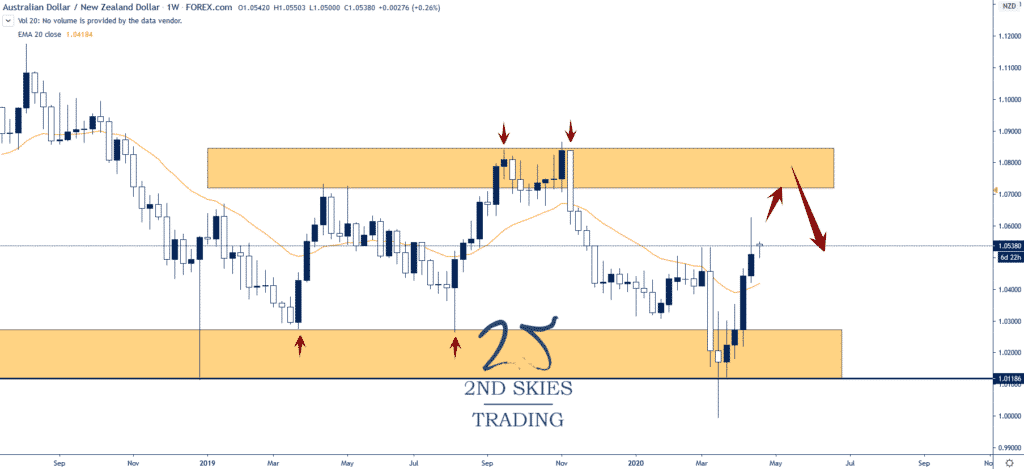
After probing the parity level in early March, the AUDNZD has rallied 4 of the last 5 weeks and is looking to retest the major resistance zone ahead between 1.07 and 1.0842.

I’m looking to sell this pair on rallies into the zone and am watching for trade setups to get short.

audnzd forex trade idea 2ndskies

Trending Analysis

ST bullish but MT neutral while inside this larger range between 1.0842 and 1.0118

Key Support & Resistance Levels

R: 1.07, 1.0842

S: 1.0274, 1.0118

Stay tuned to our members market commentary for updates.

******

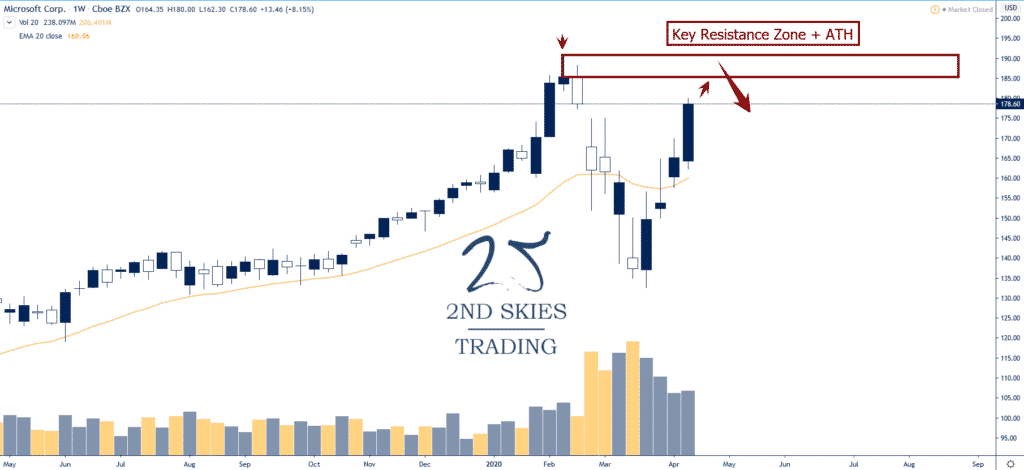
Stock Trade Idea: $MSFT (Microsoft) – Likely Profit Taking At ATH’s (weekly chart)

Price Action Context

One of the stocks we talked about buying in our is the stock market going to crash article was Microsoft ($MSFT). 

Our feeling was the leaders before the crash are most likely going to exhibit strength when it returns, and Microsoft was looking strong before the stock market crash.

Fast forward about 1.5 months and Microsoft is one of the top performing stocks lately, bouncing 34% off its lows and almost back at the ATH (all time high).

What I’m suspecting is current longs are going to take some profit at the ATH’s near 190, thus creating a mild pullback, potentially leading to a decent sell off.

Hence I’m looking to get short at the ATH’s with a tight stop above should we get a weekly close above the ATH.

microsoft trade idea 2ndskiesforex

Trending Analysis

ST very bullish while MT neutral to slightly bullish while below 190.75 on a weekly closing basis.

Key Support & Resistance Levels

R: 183.50, 190.75

S: 151, 135

******

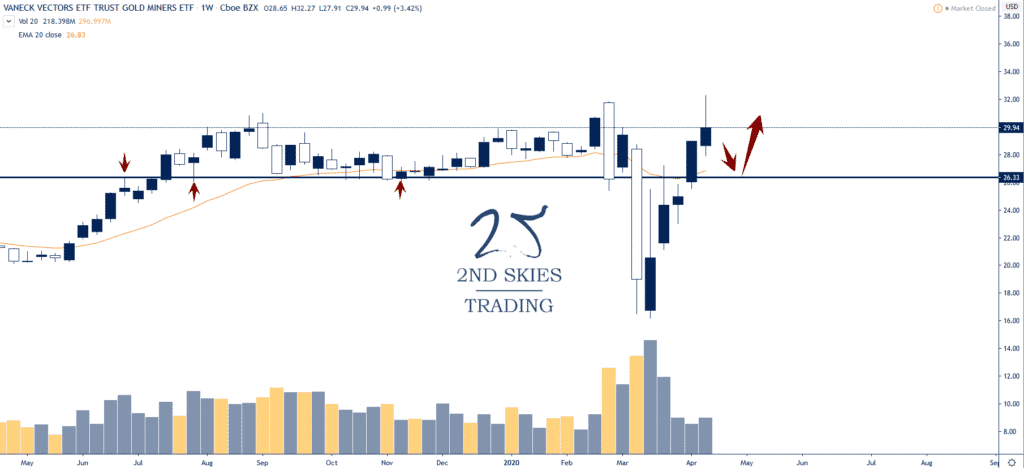
ETF Trade Idea: $GDX (Gold Miners Trust) – Looking to Buy Into Dynamic Support (weekly chart)

Price Action Context

Up 5 weeks in a row and poking at the recent range highs, the VanEck Vectors Gold Miners ETF ($GDX) is looking bullish on a MT perspective.

I’m thinking we’ll get a minor pullback here, but there is a large range of technical support meeting up with dynamic support around 25 which might be a good location to add longs.

$GDX gold miners trust etf trade idea 2ndskiesforex

Trending Analysis

ST & MT bullish while above 25 on a weekly closing basis.

Key Support & Resistance Levels

R: 32, 40

S: 26.42, 24.54

Chris Capre’s current live open price action & ichimoku trades: USDMXN, EURRUB, EURMXN, BIG, DIS, AC, ISD

New to Forex? Then check out my FREE Learn Forex Trading Course with videos, quizzes and downloadable resources

Top Trade Review: Check out our latest Top Forex Trade Review with my student banking +428 Pips on the GBPAUD (MASSIVE PROFIT!)

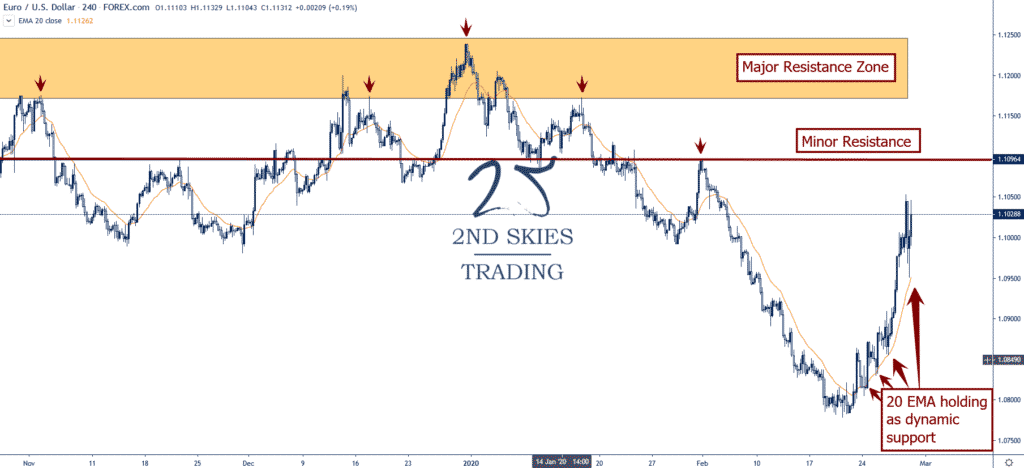
Forex Trade Idea: EURUSD – Staying Long Till Momentum Change (4hr chart)

Price Action Context

A week ago on our youtube channel we commented on the momentum change in the EURUSD captured by the change in the price action and the 20 EMA.

This is what it means to understand dynamic support & resistance.

The EURUSD call was pretty prescient as the Euro staged an impressive reversal climbing another 200 pips from when we posted that.

Looking at the 4hr chart below, you’ll see how the 20 EMA Held on 4 separate pullbacks suggesting the market is now treating it as support, thus a bullish sign for now.

I’m looking to stay long while we’re above 1.10 and the 4hr 20 EMA on a closing basis.

eurusd dynamic support 2ndskiesforex

Trending Analysis

ST bullish while above the 4hr 20 EMA and 1.10. Looking to stay long under these conditions towards 1.1175 resistance zone.

Key Support & Resistance Levels

R: 1.1096, 1.1175

S: 1.10, 1.0775

Get EURUSD updates with our members market commentary 4x per week.

******

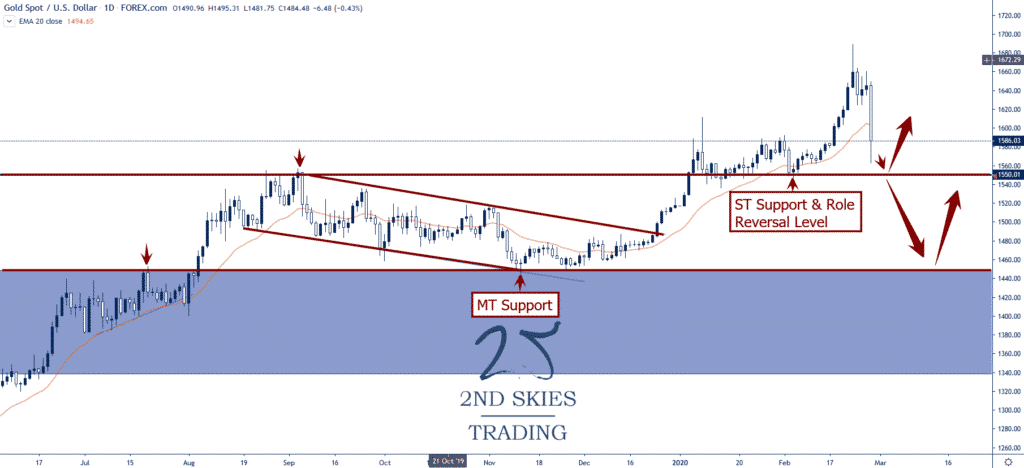
Commodity Trade Idea: GOLD (XAUUSD) ST Bearish But MT Bull Trend In Play (daily chart)

Price Action Context

While having an impressive bull run for 2020, Gold puked to end last week with billions being sold and wiping out most of the yearly gains within a matter of days.

My sense is there was a lot of profit taking in gold to subsidize losses from stock holdings (which also took a beating last week).

Regardless, ST gold isn’t my cup of tea, but I think the MT bull trend is still in place with two major support zones in play for potential longs.

gold role reversal leve 2ndskiesforex

Trending Analysis

ST bearish but looking to get long at key role reversal levels.

Key Support & Resistance Levels

R: 1660, 1770

S: 1550, 1450

******

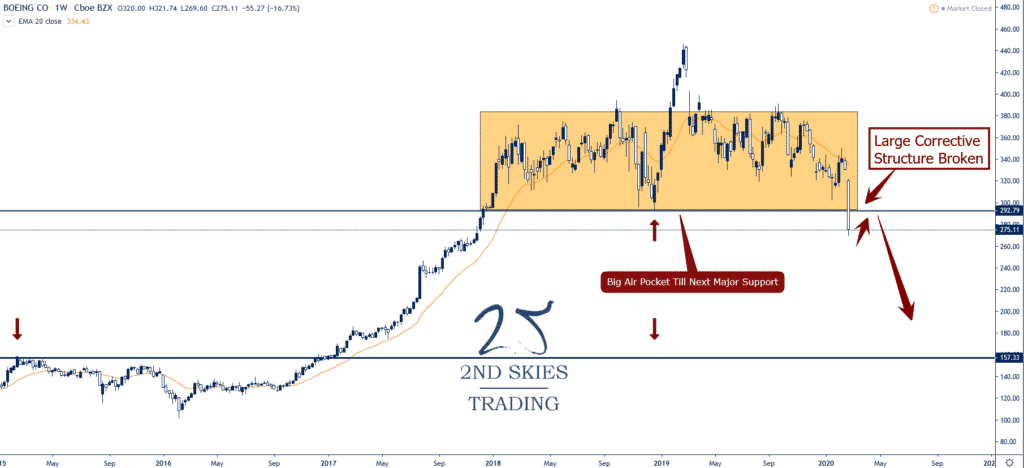
Stock Trade Idea: Boeing (BA) – Collapses Below Large Corrective Structure, Bearish (weekly chart)

Price Action Context

For the last two years, Boeing has had a base of support between 292 and 318 which has supported the stock well and created a lot of good short to medium term trade setups.

However, last week Boeing got hammered closing below the 292 base of the large corrective structure for the first time ever.

NOTE: We called a bearish setup way back at 369 which profited massively for our stock trading members.

IMO, the break below this structure is a very bearish technical event with many MT and LT stops being tripped.

Also of importance is now there is a large air pocket with only thin layers of support for the company, and nothing major till 157, so this could turn really ugly fast for this stock.

boeing stock trade idea 2ndskies

Trending Analysis

ST I’m looking to get short and stay short till we get a close above 292 on a weekly basis. Downside there could be a lot of room to run if none of the minor levels hold along the way.

Key Support & Resistance Levels

R: 292, 318

S: 242, 157

******

Chris Capre’s current live open price action & ichimoku trades: USDMXN, EURRUB, EURMXN, AUDNZD, BIG, DIS, AC, ISD

New to Forex? Then check out my FREE Learn Forex Trading Course with videos, quizzes and downloadable resources

Top Trade Review: Check out our latest Forex Top Trade Review of my student making +190 pips profit on the AUDJPY forex pair.

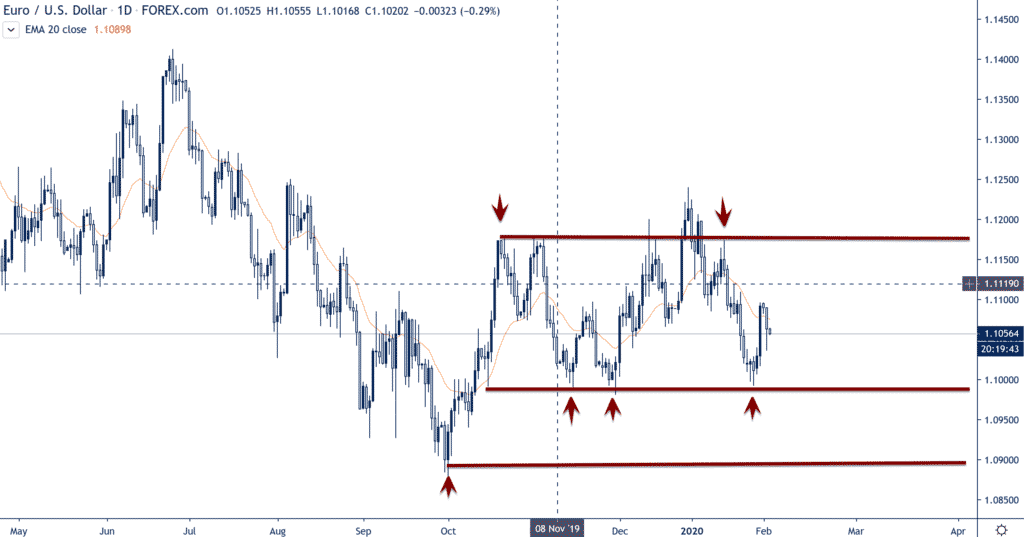
Forex Trade Idea: EURUSD – Large Corrective Structure, Looking to Buy (daily chart)

Price Action Context

Since November of last year, the EURUSD has been trading within a large corrective structure between 1.10-ish and 1.12.

We’re going to keep playing this corrective structure until we get a weekly close outside of it, and thus are looking to buy.

eurusd forex pair range structure 2ndskies

Trending Analysis

ST & MT neutral so watch structure for next directional bias.

Key Support & Resistance Levels

R: 1.0990, 1.09

S: 1.1175, 1.1245

Stay apprised with our member market commentary for updates

******

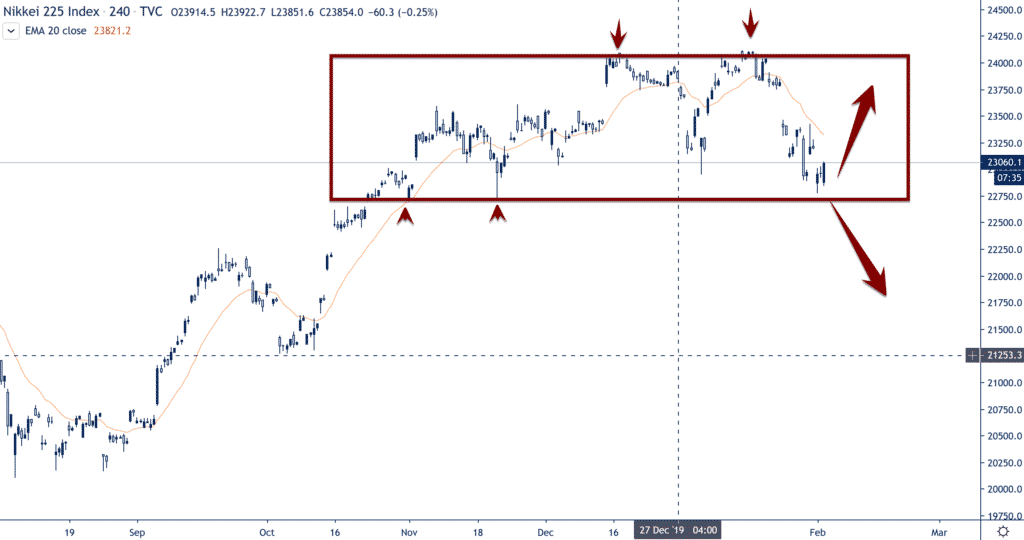
Index Trade Idea: Nikkei 225 – Trying to Hold Key Support Level (4hr chart)

Price Action Context

After a solid bull run to end last year peaking out at 24K, the Nikkei 225 has recently suffered a 1000+ point pullback, likely due to fears over the corona virus affecting the region.

Currently the index is parked inside a large corrective structure at the top of a bull run, which does point to the more probable direction being up, but we could be distributing some order flow up here.

nikkei 225 trying to hold key support 2ndskies

Trending Analysis

ST neutral while MT bullish. A weekly close below the structure and key support zone around 22800 negates the ST bull trend and shifts bias to bearish ST. A bounce from here puts the recent resistance level at 24K into focus.

Key Support & Resistance Levels

R: 24000, 25000

S: 22800, 22166

******

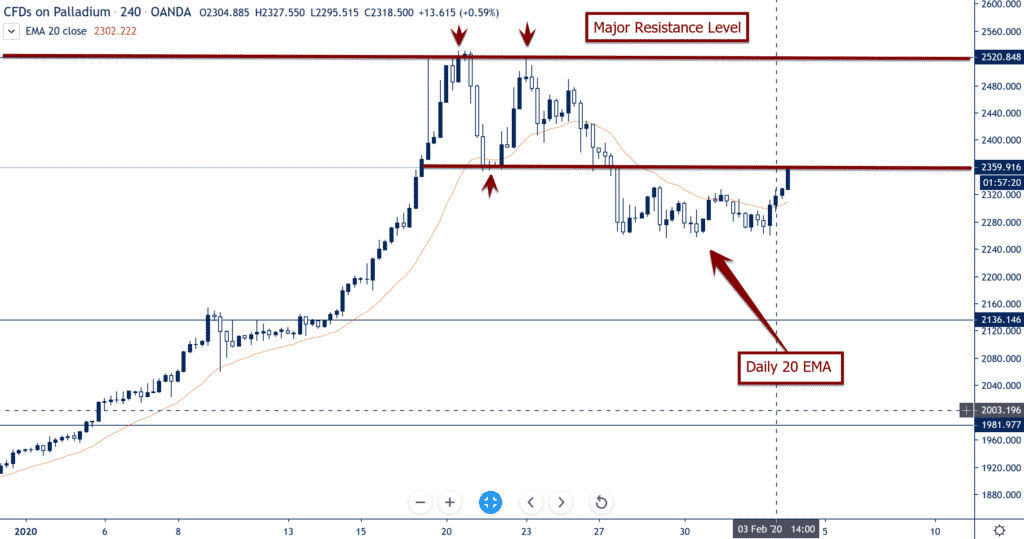
Commodity Trade Idea: Palladium (XPDUSD) – Holding at Daily 20 EMA Support (4hr chart)

Price Action Context

After the parabolic trend and exhaustion price action earlier, Palladium (XPDUSD) has found ST support at the daily 20 EMA (which comes in around 2250) and has since bounced about $100 and is attempting re-attack the recent parabolic highs.

palladium daily 20 ema support 2ndskies

Trending Analysis

ST bullish but MT neutral to bearish while the parabolic trend highs around 2520+ are still in place.

Key Support & Resistance Levels

R: 2350, 2520

S: 2250, 2149

Chris Capre’s current live open price action & ichimoku trades: USDMXN, EURRUB, EURMXN, BIG, SIG, DIS, ISD

New to Forex? Then check out my FREE Learn Forex Trading Course with videos, quizzes and downloadable resources

Top Trade Review: Watch this new Top Trade Review of my student making +177 points of profit on the Swiss 20 index

NOTE: To all our 2ndSkies Trading Community – Please be smart/safe/prepared with this corona virus going on.

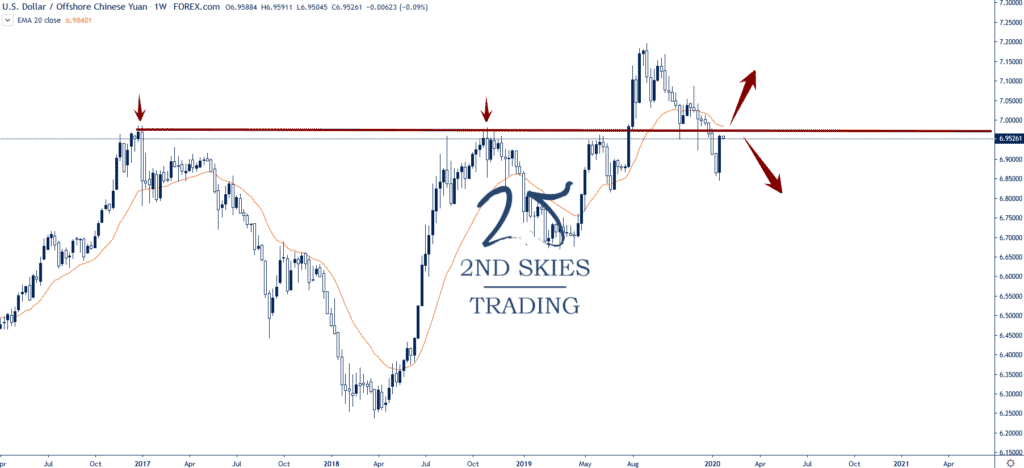
Forex Trade Idea: USDCNH – Strong Buying On Market Open, Key Resistance Just Above (weekly chart)

Price Action Context

With news out of China and the corona-virus continuing to spread, risk off has been the theme as of late, and the CNH has been suffering as a result (being ground zero of the outbreak).

For the last 4 days, the USD has gained strongly against the CNH and until this outbreak is contained, we expect this to continue.

Currently the forex pair is parked just below key resistance near 6.98. If we get a daily close above this level, then expect the pair to challenge the 7.05 and 7.15 levels which are the 2019 highs.

Trending Analysis

ST bullish and MT bearish. Need daily closing above 6.98 to turn MT trend analysis to bullish.

Key Support & Resistance Levels

R: 6.98, 7.19

S: 6.86, 6.7

Stay apprised with our member market commentary for updates

******

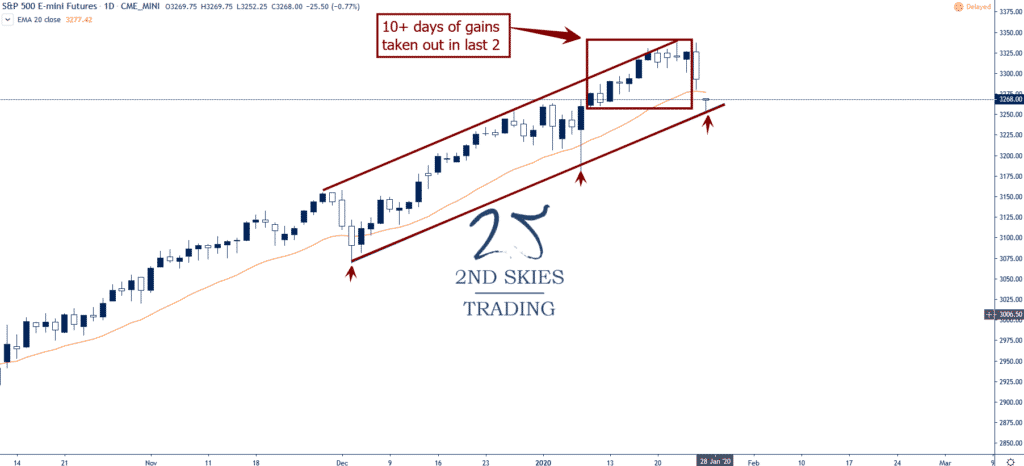
Index Trade Idea: S&P 500 – Potential Bull Trend Channel Break (daily chart)

Price Action Context

In one of the strongest bull trends in history, the S&P 500 has become rather of a joke amongst traders lately with its inability to actually sell off.

However with the corona virus starting to become more of an issue, the US index sold off about 30pts from open to close on Friday, and has gapped down below the 20 ema to start the week.

Looking at the bull trend channel on the chart, traders will be watching for a break of the channel and daily close below the 20ema as the last 2 days of selling have taken away the prior 10+ days of price action.

s&p 500 bull trend channel 2ndskies

Trending Analysis

ST bearish with the current risk sentiment while MT bullish until the channel is broken.

Key Support & Resistance Levels

R: 3336, 3400

S: 3244, 3154

******

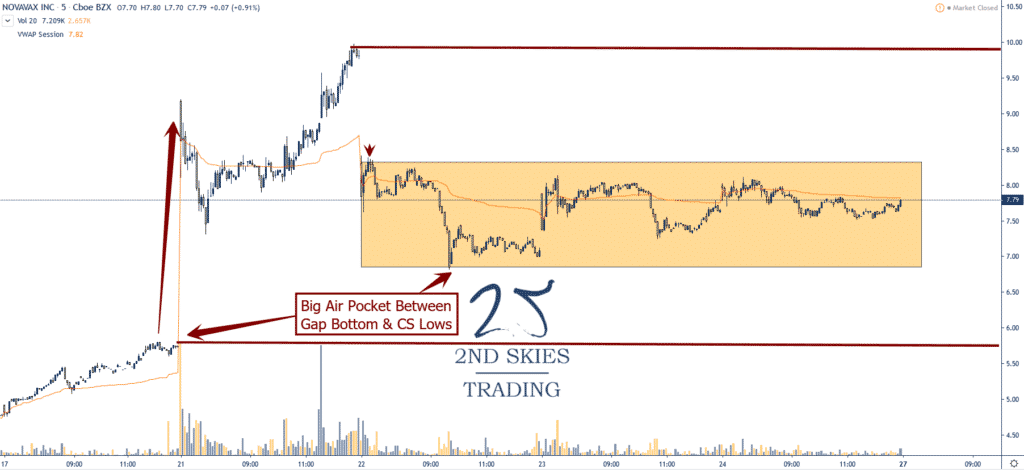
Stock Trade Idea: NVAX (Novavax) – Watching Gap + Spike Highs For Fading Opportunity (5 min chart)

Price Action Context

With the corona virus taking the top headlines globally as of late, biotech stocks have been going gang busters with vaccine makers getting huge spikes in volatility and value.

NVAX (Novavax) jumped by over 80% on the 21st last week and has been holding its gains since.

Current spike high at 10 is the target for bulls, so any break above could create some trapped bull traders should it slam back below this.

Meanwhile we got a corrective structure betwee 6.84 and 8.34 which has been dominating the price action since the 22nd.

Any break of this higher will target the 10 handle while breaking below would likely fill the air pocket to the gap bottom near 5.60

nvax stock trade idea 2ndskiesforex

Trending Analysis

ST & MT bullish while above gap bottom around 5.60 on a daily closing basis.

Key Support & Resistance Levels

R: 8.34, 10

S: 6.87, 5.81

Chris Capre’s current live open price action & ichimoku trades: CORN, USDMXN, EURRUB, EURMXN, BIG

New to Forex? Then check out my FREE Learn Forex Trading Course with videos, quizzes and downloadable resources

Top Trade Review: Watch this live trade review of my student banking +115 pips of PROFIT & +11R on the USDJPY

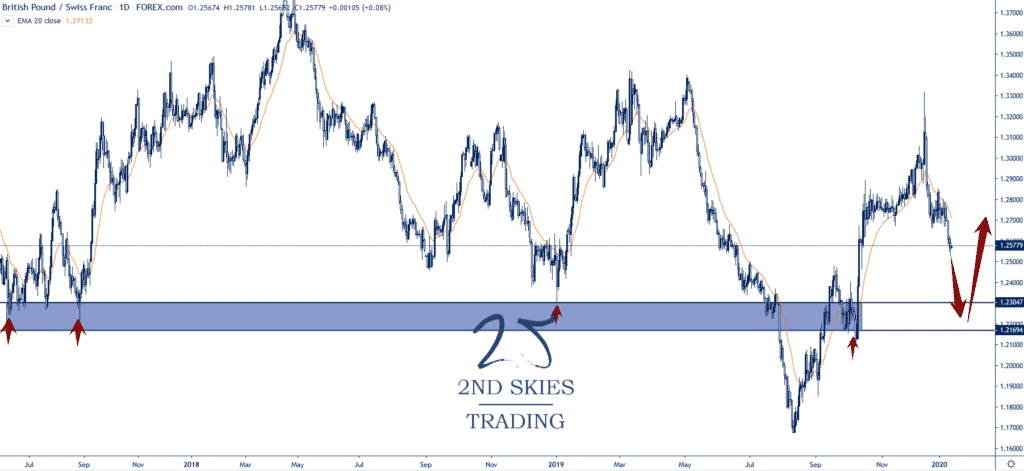
Forex Trade Idea: GBPCHF – Watching Major Support Zone For Buy Setup (daily chart)

Price Action Context

Gaining heavily to end last year and heading into the UK election, the GBP pairs have sold off from the Dec 19′ highs and are starting to offer some potential value plays.

The GBPCHF forex pair is only a couple handles away from a major support zone between 1.2303 and 1.2169 which I’m expecting some longs to be parked and shorts to take some profits.

gbpchf forex trade idea 2ndskiesforex

Trending Analysis

ST bearish but MT neutral – bullish while above the support zone on a weekly closing basis.

Key Support & Resistance Levels

R: 1.28, 1.30

S: 1.2303, 1.2169

Stay tuned to our members market commentary for updates

Chris Capre’s current live open price action and ichimoku trades: USDJPY, AUDCAD, SLV, AUS200

New to Forex? Then check out my FREE Learn Forex Trading Course with videos, quizzes and downloadable resources

Did you see my live trade setup on the AUDCAD? Don’t miss how I grabbed a quick +125 pips of profit breakout trading with a near perfect entry.

AUDNZD – Big Winner vs NZD 50bps Rate Cut, Staying Long (1hr chart)

Price Action Context

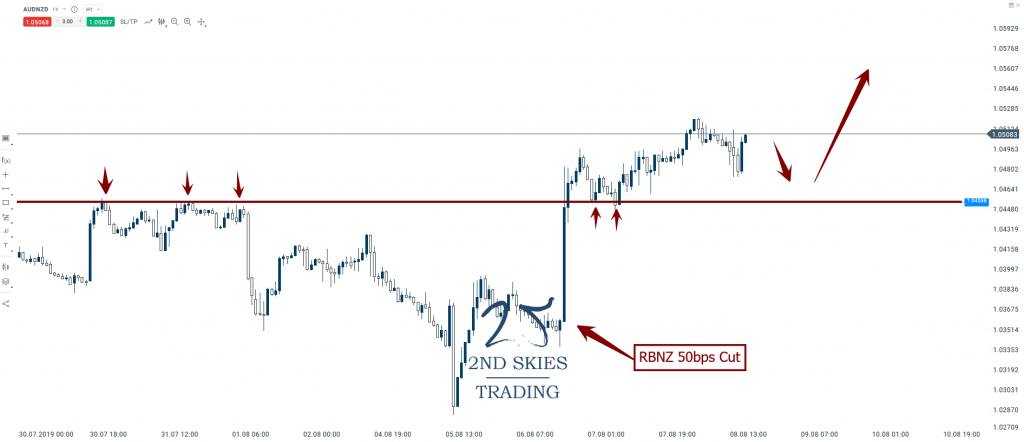
While MT in a bear trend, ST the AUDNZD is a in a bull trend after bouncing off the key support near 1.0298, and then sky-rocketing after the surprise RBNZ 50bps cut. Notice the breakout pullback setup off of the prior ST highs near 1.0453 as the level held perfectly and has produced a decent bounce thus far.

audnzd-breakout-pullback-setup-2ndskiesforex

Trending Analysis

ST I’m staying bullish and am expecting a move north to pass 1.06+. Traders not already long should look for pullbacks towards support for potential buying opportunities.

Key Support & Resistance Levels

R: 1.0545, 1.0615

S: 1.0454, 1.03

Chris Capre’s current live open price action and ichimoku trades: USDJPY, AUDCAD, SLV, AUS200

New to Forex? Then check out my FREE Learn Forex Trading Course with videos, quizzes and downloadable resources

What is happening in the forex market? Check out my latest video on how this unique volatility environment will affect your forex trading

EURUSD – Broken Below MT Support (Daily chart)

Price Action Context

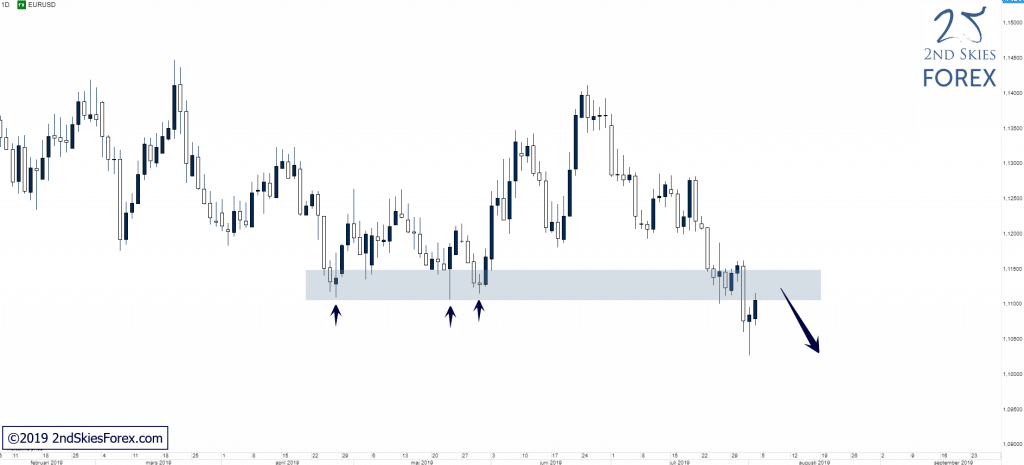
After bulls got rejected around 1.14 in the end of June sellers re-took control and EURUSD has now broken below a key support zone and produced a new lower low MT, opening up for a likely continuation lower towards 1.09 if bears are able to stay in control.

EURUSD_Broken_Below_MT_Support

Trending Analysis

Bias is bearish and the current pullback into the broken support which now should act as resistance can be of potential interest to bears looking to short the pair.

Key Support & Resistance Zones

R: 1.1100 – 1.1150

S: 1.0800 – 1.0900

Stay tuned to our members private trade setups channel for updates.

******

ASX – Testing Major Resistance & ATH (Monthly chart)

Price Action Context

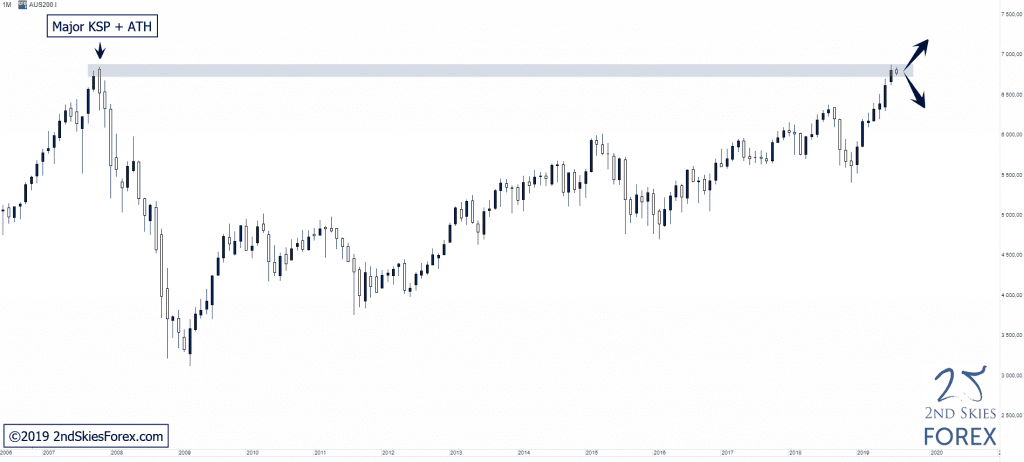
Australia’s index is now testing the ATH resistance zone from the pre-financial crisis high back in 2007, something we highlighted as a possibility in our top trade ideas for 2019 video.

ASX_Testing_Major_Resistance__ATH

Trending Analysis

LT bias is bullish, but considering the significance of this ATH, at a minimum, a solid bearish ST rejection from this key resistance is very likely IMO, which can present potential shorting opportunities to bears. A LT break and close above 6880 would open up further upside for the index.

Key Support & Resistance Zones

R: 6780 – 6880

S: 6330 – 6450

You can trade the ASX200 index via our preferred trading broker here.

******

XAUUSD – MT With-Trend Corrective Structure Above LT Key Support (4h chart)

Price Action Context

Mid-June, the precious metal successfully cleared the multi-year resistance we’ve mentioned in our recent member market commentaries, opening up further upside. Since, price has produced a MT with-trend corrective structure which for now seems to be holding.

XAUUSD_MT_Corrective_Structure_Above_LT_Key_Support

Trending Analysis

LT bias is bullish and bulls can look for potential trading locations on pullbacks towards the CS bottom and LT key support.

Key Support & Resistance Zones

R: 1 437 – 1 453

S: 1 360 – 1 392 (LT Support)

You can trade spot gold via our preferred trading broker here.

Chris Capre’s current live open price action and ichimoku trades: USDMXN, VIX, CAMP, EA

New to Forex? Then check out my FREE Learn Forex Trading Course with videos, quizzes and downloadable resources

Want to learn how to draw support and resistance? Check out my latest video How To Draw Support & Resistance (5 Tips)

EURGBP – Running Into Major Resistance (Weekly chart)

Price Action Context

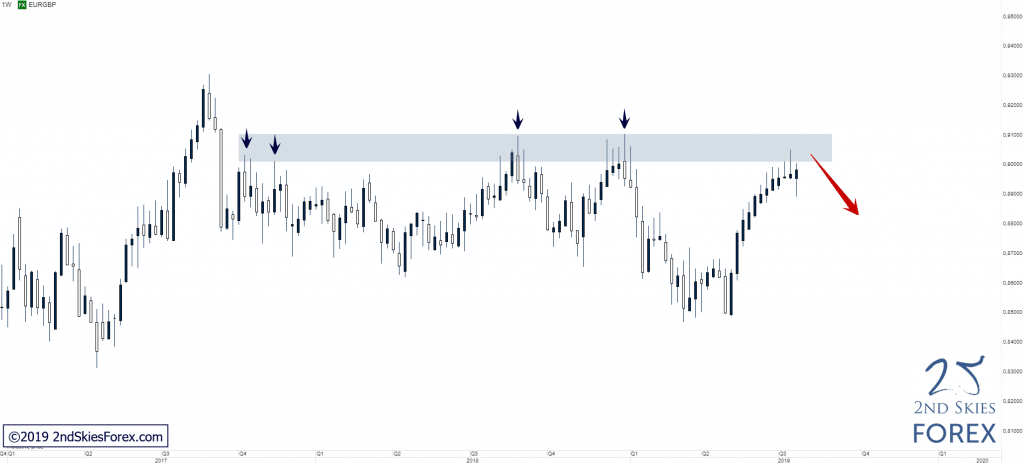
After a failed bearish continuation + false break back above LT support in May, the strong MT bull run that followed has taken the pair all the way back up to a major LT resistance that has held since Q3 2017.

EURGBP_-_Running_Into_Major_Resistance

Trending Analysis

Overall neutral bias with the LT resistance offering potential bearish plays with 0.8710 being the closest LT support to look out for. A break above 0.9100 would technically open up for a continuation towards 0.9300.

Key Support & Resistance Zones

R: 0.9000 – 0.9100

S: 0.8620 – 0.8710

Stay tuned to our members market commentary for updates.

******

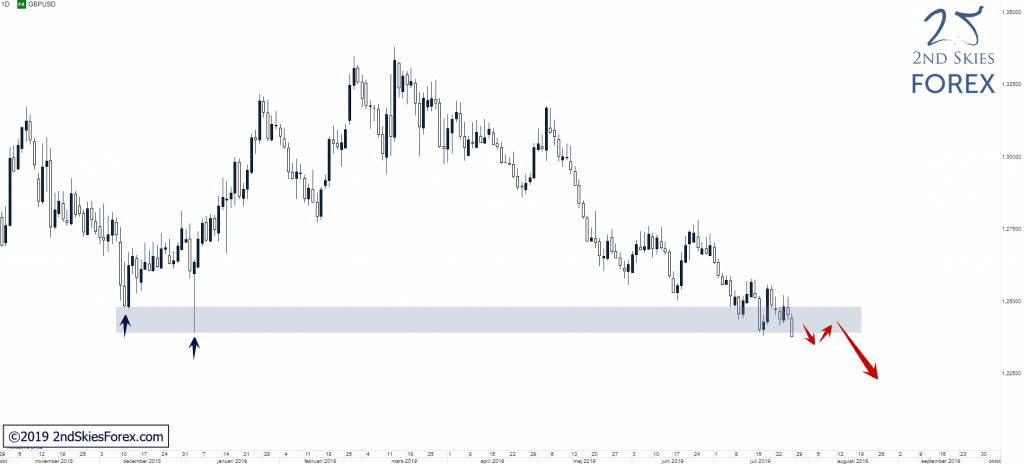
GBPUSD – Attempting To Break Key Support (Daily chart)

Price Action Context

After being rejected twice from 1.3300 in Feb/Mar, price sold off towards the lows created in 2016/2017. Bulls seem to be absent and unless they step in soon, it’s like this key support zone will fail to hold IMO as price action is looking very weak atm.

GBPUSD_Attempting_To_Break_Key_Support

Trending Analysis

LT bias is bearish and a strong break and close below this key support level opens up for a likely bearish continuation towards the 2016/2017 lows and can offer potential short plays for bears.

Key Support & Resistance Zones

R: 1.3300 – 1.3385

S: 1.2400 – 1.2485

******

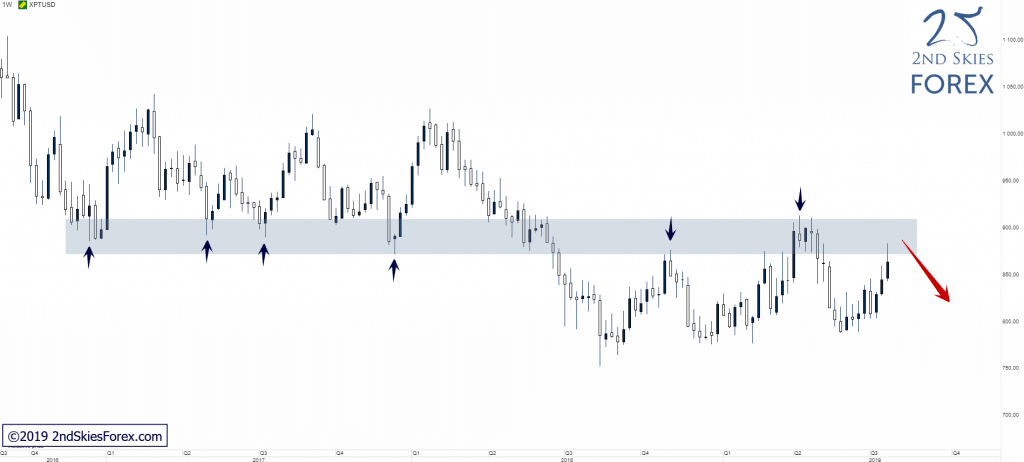
XPTUSD – Back @ LT Key Resistance (Weekly chart)

Price Action Context

After reversing a bit shy of the LT support zone, Platinum is now back at the LT resistance which has rejected price multiple times since mid-2018.

XPTUSD_Back__LT_Key_Resistance

Trending Analysis

LT bias is bearish and if bears successfully can defend this zone a move back down towards the LT support is likely. A strong break and close above this zone on the other hand would put 1 010 back into focus.

Key Support & Resistance Zones

R: 870 – 915 S: 754 – 777