Tag Archive for: forex

Chris Capre’s live open price action and ichimoku trades: GBPUSD, NZDJPY, USDJPY, USDNOK, CAC40, VIX

New to Forex? Then check out my FREE Learn Forex Trading Course with videos, quizzes and downloadable resources

How Much Should You Risk Per Trade? Watch our latest video How Much Should You Risk Per Trade {3 Rules}

GBPJPY – Testing Multi-Year Support (Weekly chart)

Price Action Context

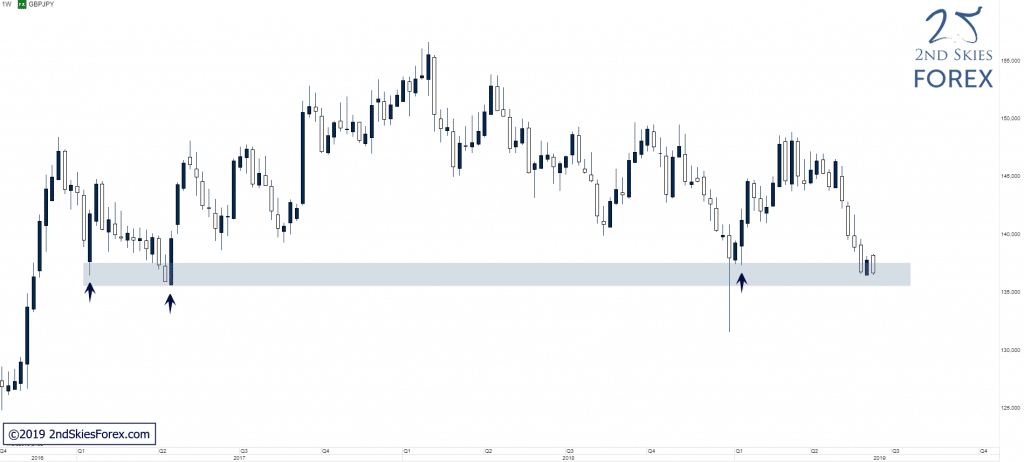
After breaking below 140.00, the strong selling continued and the pair is now testing a multi-year support zone at which I think at least a solid ST bounce is likely considering the significance of this support zone.

forex-gbpjpy-key-support-2ndskies

Trending Analysis

If bulls are able to successfully defend this key support, a move back up towards 140 is likely IMO and should 140 fail to stop price, 148 would be the next key resistance to look out for. A failure of this support on the other hand would open up a solid amount of downside with 130 being the first support in line to look out for.

Key Support & Resistance Zones

R: 138.60 – 140.00
S: 135.50 – 137.50


******

XAUEUR – Broken Above Key Resistance, Potential False Break (Daily chart)

Price Action Context

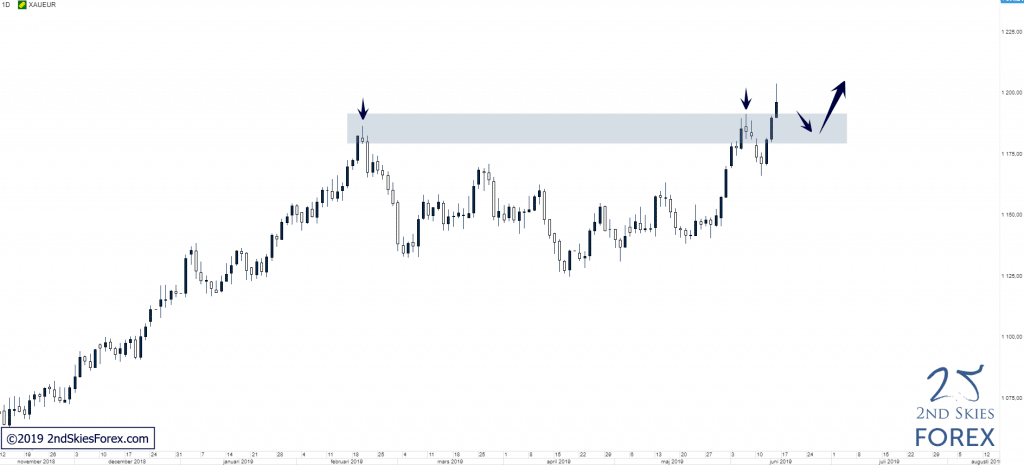
After a brief rejection at the KSP from February, the precious metal found support at 1 170 and impulsively broke above 1 190, producing a solid bullish close above the resistance.

gold-vs-euro-bullish-trend-2ndskiesforex

Trending Analysis

LT bias is bullish and weak pullbacks towards the broken resistance can present potential buying opportunities. A break and close back below 1 180 would render this a CT FB and initially open up for a move back down to 1 135.

Key Support & Resistance Zones

R: 1 215 – 1 225
S: 1 180 – 1 190

******

DAX – Holding Above ST RRL (1h chart)

Price Action Context

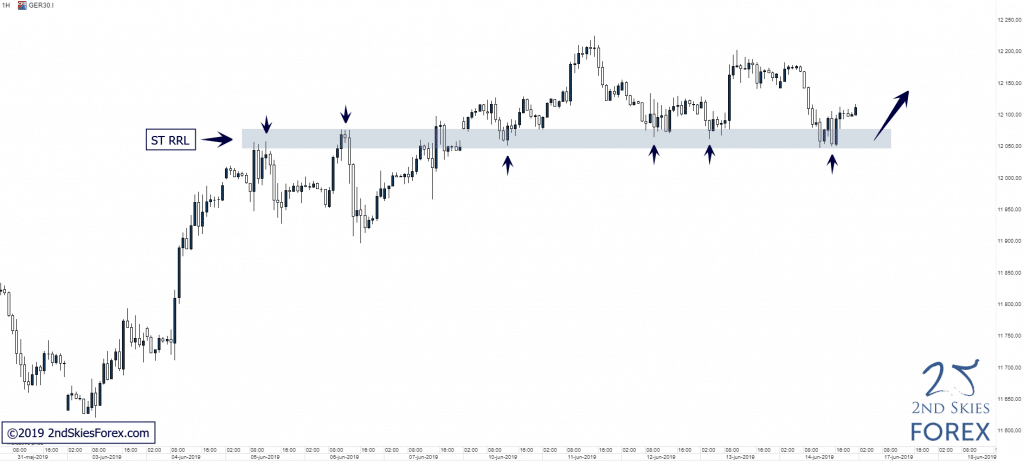
After putting in a WT false break at 11 850, which we talked about in our commentary on the 8th of June, price continued trading higher and is currently holding above a ST RRL.

dax-trade-signal-2ndskiesforex

Trending Analysis

LT bullish bias and bulls can look for possible buying opportunities around the ST support level. A break below this ST support would open up for a move lower back into 11 850 which in turn also could present potential buying opportunities IMO.

Key Support & Resistance Zones

R: 12 173 – 12 225
S: 12 045 – 12 080

Chris Capre’s live open price action and ichimoku trades: GBPUSD, NZDJPY, USDJPY, USDNOK, CAC40, VIX

New to Forex? Then check out my FREE Learn Forex Trading Course with videos, quizzes and downloadable resources

What is our preferred web based trading platform? Check out our latest platform review on the xStation 5.

EURAUD – Major Resistance Zone Ahead. Selling Opportunity? (Daily Chart)

Price Action Context

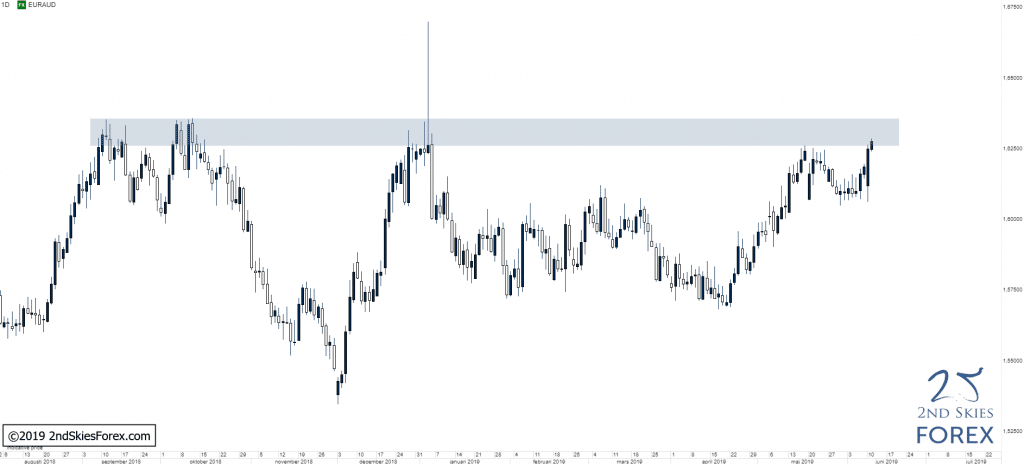
LT we’re in a big range between 1.53 and 1.63. The lows are building over the last 2 round trips to the key resistance zone ~ 1.6250 and 1.6350. There is also the spike high from Dec. last year which goes up towards 1.67.

euraud-approaching-key-resistance-zone-2ndskiesforex

Trend Analysis

LT neutral while inside this large zone, ST bullish as we’re producing lower highs and continually pressuring the resistance zone above. Traders will need to watch out for a false break setup above the zone, but there are potential opportunities to be short at the zone and long above.

Key Support & Resistance Levels

R: 1.6250 – 1.6350, 1.67

S: 1.61 – 1.565

Chris Capre’s live open price action and ichimoku trades: EURUSD, GBPUSD, AUDJPY, EURCZK, CAC40, VIX

New to Forex? Then check out my FREE Learn Forex Trading Course with videos, quizzes and downloadable resources

What is our preferred web based trading platform? Check out our latest platform review on the xStation 5.

NZDJPY – Pulling Back Towards Key Resistance (Daily chart)

Price Action Context

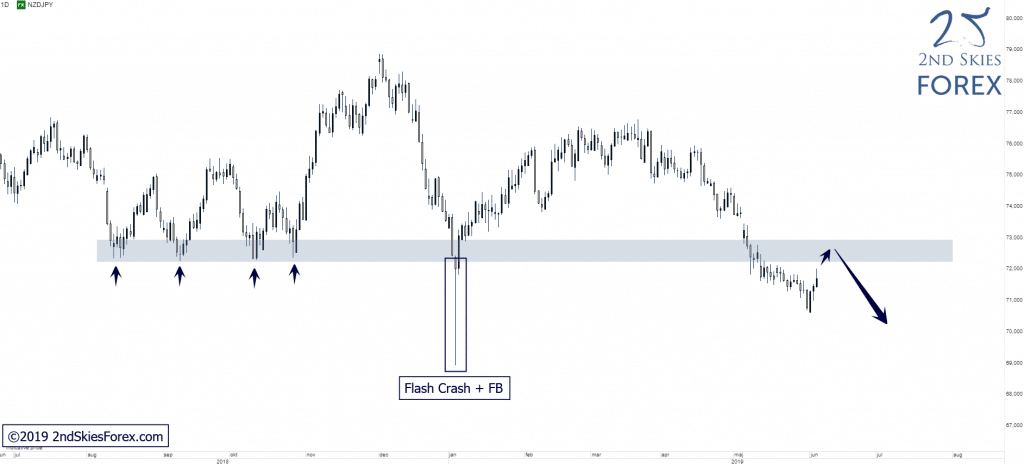
On the 13th of May, NZDJPY cleared a LT key support zone followed by a 2-3 week correction before selling picked up again. After putting in a ST bottom + reversal around 70.70, price is now closing in on the broken LT support, now acting as resistance. If bears can defend this resistance zone successfully, a bearish continuation towards the major support around 69.80, dating back all the way to 2009, is likely IMO.

nzdjpy-forex-trade-signal-2ndskiesforex

Trending Analysis

Bearish LT bias and sellers can look for potential trading locations around the key resistance.

Key Support & Resistance Zones

R: 72.25 – 72.85
S: 68.25 – 69.80

Chris Capre’s live open price action and ichimoku trades: EURUSD, GBPUSD, AUDJPY, EURJPY, EURCZK, EU50

New to Forex? Then check out my FREE Learn Forex Trading Course with videos, quizzes and downloadable resources

Forex Trading Q&A: How We Teach Price Action Skills & Why You Need Patience {New Video}

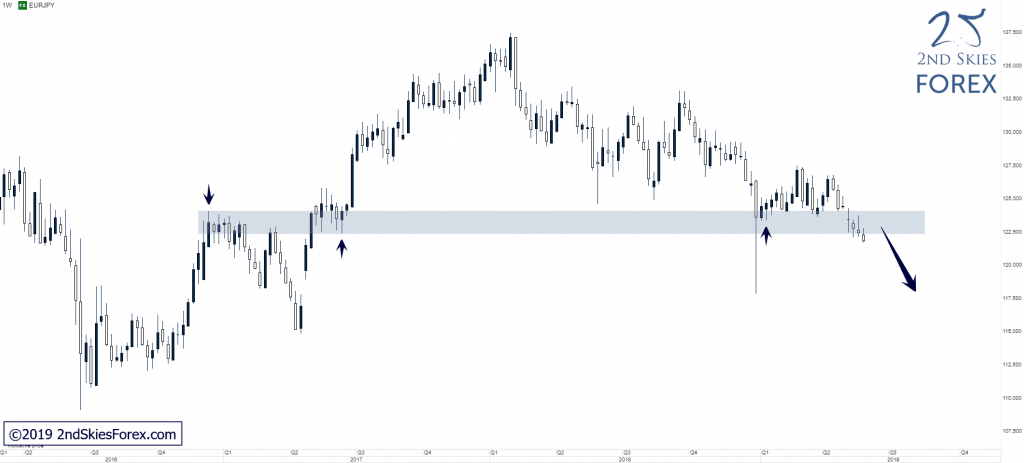
EURJPY – Breaking Below LT Key Support Zone (Weekly chart)

Price Action Context

With almost no signs of bullish order flow over the last few weeks, price has slowly been chewing its way through the LT key support zone we’ve mentioned in earlier commentaries, and this week we’re seeing the first solid attempt by bears to fully clear this support zone.

eurjpy-forex-trade-setup-2ndskies

Trending Analysis

A strong weekly close below this support zone would open up for a potential bearish continuation towards 1.1860, whilst a bullish impulsive move back above the support zone would render this a false break and put 1.27 back into focus.

Key Support & Resistance Zones

R: 122.50 – 124.00
S: 118.60 – 117.70

Chris Capre’s live open price action and ichimoku trades: EURUSD, GBPUSD, AUDJPY, EURJPY, EURCZK, EU50

New to Forex? Then check out my FREE Learn Forex Trading Course with videos, quizzes and downloadable resources

Forex Trading Q&A: How We Teach Price Action Skills & Why You Need Patience {New Video}

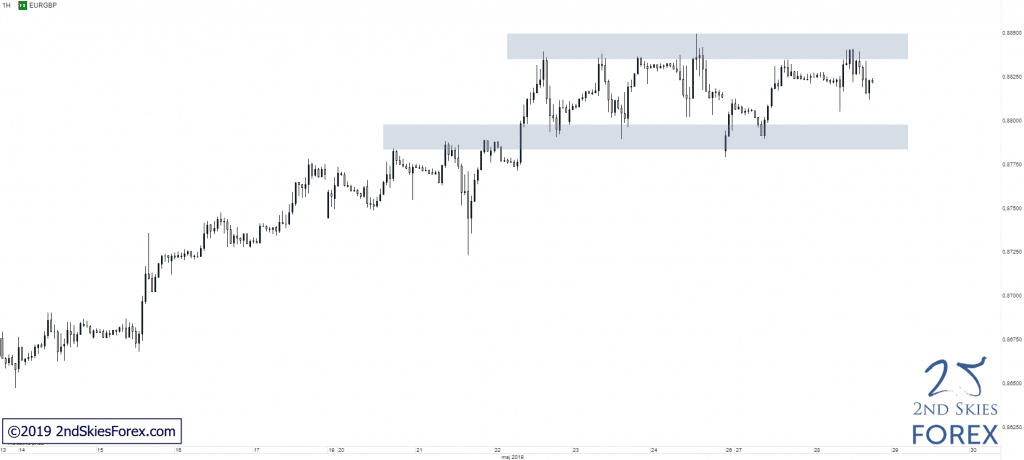
EURGBP – ST Corrective Structure After Bullish Run (1hr chart)

Price Action Context

After an impressive bullish run with the GBP falling heavy impacted by Brexit uncertainties and PM May resigning, the EURGBP cross forex pair has gained heavily adding over 225 pips since the last two weeks.

eurgbp-forex-pair-trade-setup-2ndskiesforex

Trending Analysis

ST we remain bullish while the ST corrective structure is in play and are looking to trade with trend.

Support & Resistance Levels

R: 8850, 8915

S: 8780, 8700

In our new youtube series, we’ll be answering questions from the trading community covering various topics such as trading strategies, how to trade the forex market, risk management, trading psychology and how to build a winning mindset.

If you’ve struggled with any aspects of this in your trading, then make sure to post a comment as we might feature your comment in the next video.

In this week’s video, we’re answering a question from Dennis who asked that since we don’t trade confirmation price action signals, how do we choose our price to get in and what methods do we employ? 

Dennis also talked about some trading situations such as:

-price coming 1 pip from our entry and taking off towards our target
-price creating a false break, stopping us out and then going to our target

He wanted to know how we manage all these uncertainties.

Has this ever happened to you?

If so, then make sure to watch this forex trading video and leave a comment to get your question asked in the next video.

Read more

Forex Trading Q&A: How We Teach Price Action Skills & Why You Need Patience

In this week’s video, we’re answering a question from MJ who was a confirmation price action trader (i.e. trading candlestick patterns) and was having trouble converting from that to placing entries without specific candle patterns for his trade setups.

MJ was specifically asking about trading breakouts and our breakout strategy, along with how to enter on a breakout setup.

If you’ve struggled with any aspects of this in your trading, then make sure to post a comment as we might feature your comment in the next video.

Read more

A question I got today from one of my facebook followers said “Hey Chris, what kind of forex trading strategies do you use and how do you use them?” This was too big a question to dole out over my 2ndskiesforex facebook page, so I decided to write a short post about this.

What Forex Trading Strategies Do I Use?

Although I use the same strategies I do for all markets, these are the ones I use for trading forex as well, which can be grouped into two main classes:

Price Action & Ichimoku Cloud Trading

Regardless of the asset class, I trade price action and ichimoku cloud trading, however I use them both differently to some degree which I’ll clarify.

Price Action Trading

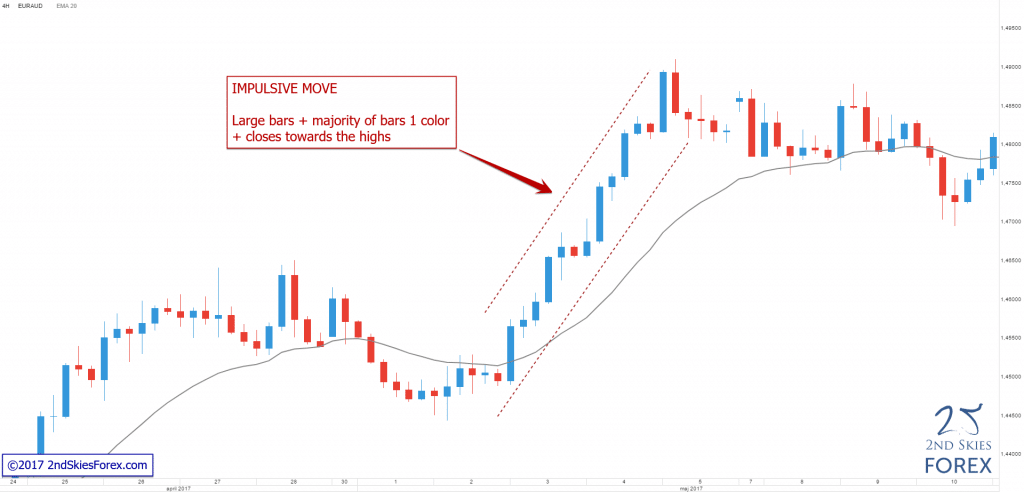
As a whole, I’m always using price action because I consider it to be a ‘core’ or fundamental skill. I am always using my price action skills regardless of the instrument, asset class, time frame or environment.
2SF-Trading-Article-2017-05-Impulsive-move-1024x492

So I can be trading price action strategies on the 1 minute, 3 minute, 5 minute and 1 hour time frames for day trading, or the daily and 4 hour time frames for swing trading. I can be trading price action on forex, futures, stocks, commodities, global indices, CFD’s, forex options – you name it. And I’m always using my price action skills in any environment (trending, ranging, choppy or clean).

It is such a fundamental skill – very much like a good football player is using footwork, that I’m always using it and applying these skills on every chart.

Make sure to notice my use of the word ‘skills‘ here. It’s important you understand why I’m using that (which I’ll elaborate more on later).

Ichimoku Cloud Trading

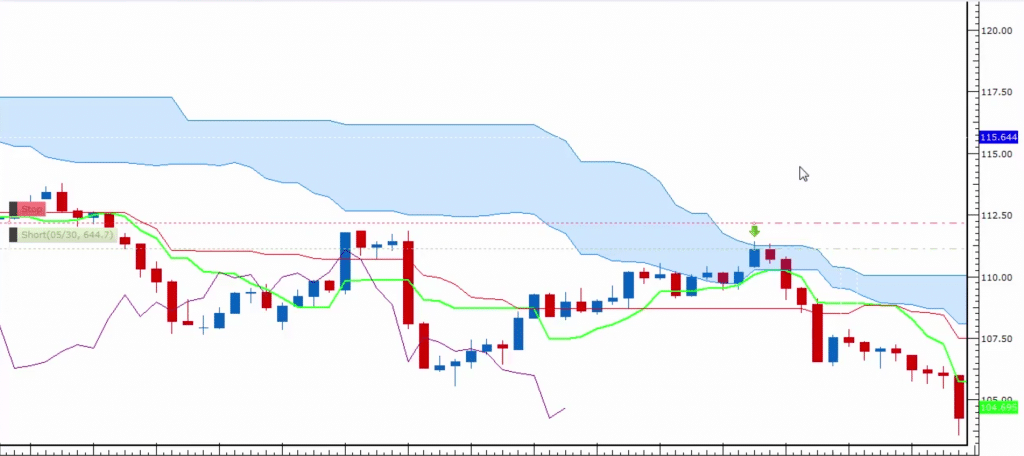
Ichimoku cloud trading as a whole is what I consider a more ‘specialized‘ skill, so I’m not using it on every chart, and am applying it in a much more specialized way. I don’t consider ichimoku to be a core skill, but I do consider it to be a powerful one when understood and used properly. Ichimoku will give you a unique perspective on future support and resistance levels, what the underlying momentum is (strong, medium or weak), what the current ichimoku wave structure is like (and will likely look like in the future), where are potential turning points, etc.
live-ichimoku-trading-2ndskiesforex

I apply ichimoku pretty much on any instrument, however one main difference is I don’t really trade it on lower time frames, so any time frame below the 1 hour chart. That is because my testing really hasn’t found it to be stable enough on lower time frames.

Is it possible you can use on those lower TF’s? Yes, but I haven’t found a consistent skillful way to do it over time. The time frames I trade ichimoku on are the 1 hour, 4 hour, daily, weekly and monthly.

So in essence, I’m using it for more short term swing trading, medium term swing trading, and for some long term trend changes to capture some really large moves, moves that may take months to fully deliver, but could often be in the 500-1000+ pip plus range. The longer moves often add a second income through the carry trade, so an opportunity for two incomes on the trade.

Getting Back To Skills

If there is one thing I’ve learned which has separated me from most trading mentors, is that, just like great athletes focus on continually building their skills, I focus heavily on building trading skills.

I’ve seen some forex trading mentors churn out trading strategy after trading strategy, sometimes 20+ over the years. However if you notice, the strategies they came up with 5+ years ago they are not using today. Meanwhile, I am still using many of the same strategies from the last 5 years, and they’re still effective as I’m a verified profitable trader.

What’s the difference between me and the strategy churners?

My core focus is on trading skills because trading is a skill based endeavor. It’s not a ‘strategy’ based endeavor, but a skill-based endeavor. When you realize this, you’ll see a major change in your mindset. You’ll start thinking like a millionaire trader.

If you have solid trading skills, you’ll be able to adapt to any market, and the market is always changing. This is why so many struggling traders fail to make money. They think short term. They think they only need a trading strategy to make money in the markets.

Think about it like this: would you ever walk into a martial arts school, and ask them “Can you give me a martial arts strategy for beating up someone 6’3″ tall?” Of course not, because there would be no one strategy for that person, and even if the sifu could give you one, without the proper skills to execute that strategy (stance, footwork, punching/kicking technique, muscle memory, strength, speed, accuracy, etc.), it would be completely useless.

The path to becoming a black belt in any martial arts is paved through building skills.

Hence, if you’re just thinking you need a winning strategy to make money trading – you’re using the wrong approach. What you need are trading skills that work on at least one instrument or asset class across multiple environments, and ideally across all time frames. If you have that, then you’re adaptable and have a set of skills which allows you to handle all the environments you will encounter.

Hopefully you can now see why a profitable trading strategy alone is insufficient to make money trading long term.

So there you have it – those are the two forex trading strategies I use every day when I’m trading the forex market (along with trading stocks, futures, options, commodities, global indices and CFD’s).

I didn’t get into any specific price action or ichimoku strategies. If you want to learn more about my specific trading strategies, you can check out my price action course, or my ichimoku course where you will learn exactly how I trade those strategies day in – day out.

I hope you enjoyed this trading article. Don’t forget to leave a comment sharing your thoughts below.

Until next time, may you find real progress in your trading performance and mindset.
Chris Capre’s current live price action and ichimoku trades: EURUSD, GBPUSD, USDMXN, USDJPY, EU 50, BIR, TLS

NOTE: Check out my top trade ideas for 2019.

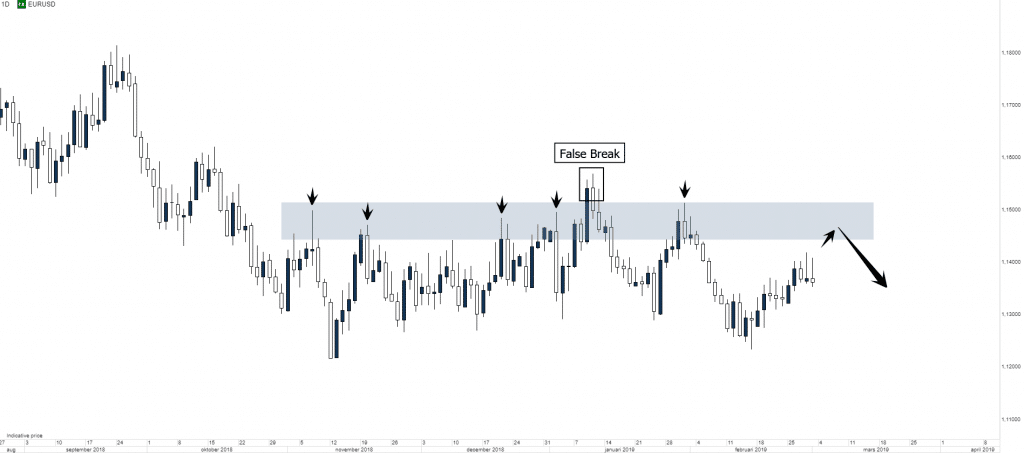
EURUSD – Pulling Back Towards Key Resistance (Daily chart)

Price Action Context

After a failed attempt to fully clear the LT support between 1.1270-1.1300, bulls managed to re-gain some control, but the weak and very volatile bullish move from the support isn’t very convincing, suggest a more balanced order flow and continued bearish presence.

eurusd-price-action-forex-2ndskiesforex

Trending Analysis

LT bias remains bearish while below 1.1515 and a potential move back up to the key resistance zone can offer possible trading locations to bears.

Key Support & Resistance Zones

R: 1.1450 – 1.1515
S: 1.1220 – 1.1275

Stay tuned to the members daily trade ideas for updates.

******

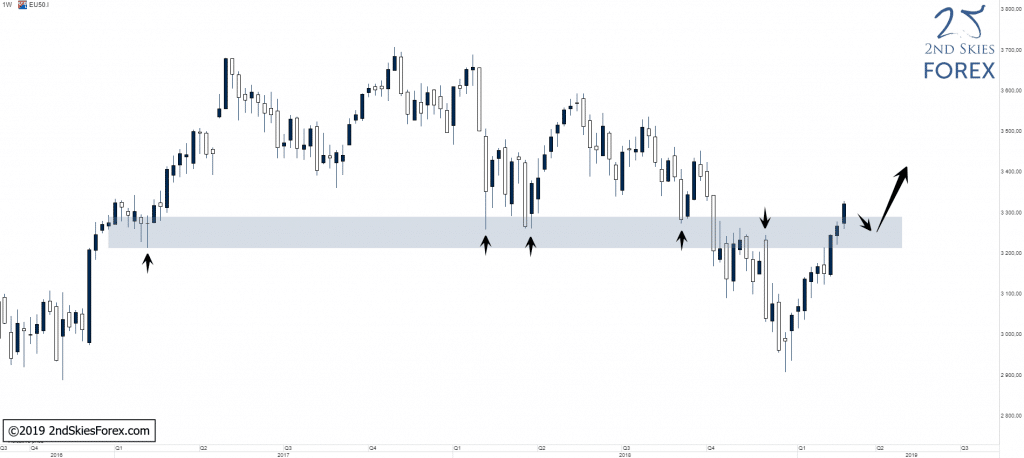
EURO STOXX 50 – Back Above LT Key Support, Bullish Bias (Weekly chart)

Price Action Context

Like many other indices, the Euro Stoxx 50 has now broken back above a key resistance level, which now should act as support.

euro-stoxx-50-trade-setup-2ndskiesforex

Trending Analysis

LT bias changed back to bullish and weak pullbacks into the broken resistance, now support, will likely be of interest to bulls.

Key Support & Resistance Zones

R: 3660 – 3710
S: 3215 – 3280

******

WTI – Holding Above LT Key S/R Zone (Weekly chart)

Price Action Context

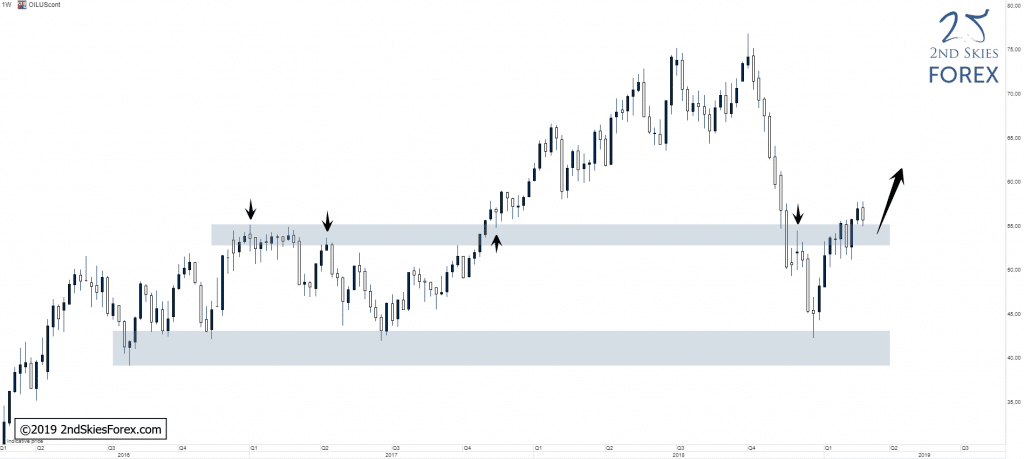
WTI bounced heavily from the multi-year support and has now broken back above a LT key S/R zone, initially opening up for a potential continuation towards 59.00.

wti-oil-trade-ideas-2ndskiesforex

Trending Analysis

LT bias bullish with the LT key S/R zone offering potential buying opportunities.

Key Support & Resistance Zones

R: 64.25 – 66.70
S: 53.20 – 55.20

What You’ll Learn In This Article:

-Trading in the summer
-What are two unique factors affecting trading this summer
-What preferred strategies and instruments I’m watching this summer

As traders, our job is to constantly adapt to an ever changing environment of price action, liquidity and volatility. Trading markets in the summer often experience a decrease in volatility and liquidity whereby many professional traders go on vacation, spend time with their kids, thus affecting market liquidity and volatility.

summer trading forex 2ndskiesforex

In today’s trading article, I’m going to talk about how this summer is different for two reasons you need to understand, along with how you can profit during the summer months, adjust your trading strategies, and maximize your time + profitability behind the charts.

How Trading This Summer Is Different (Trading Insight #1)

This summer has an additional element contributing to the typical summer trading conditions.

It has the World Cup, which is only hosted every 4 years. Because of this, and being such an international event, there is extra impetus for traders to be less active and order flows to change drastically as 3-4 billion people globally are watching the games (myself included :-).

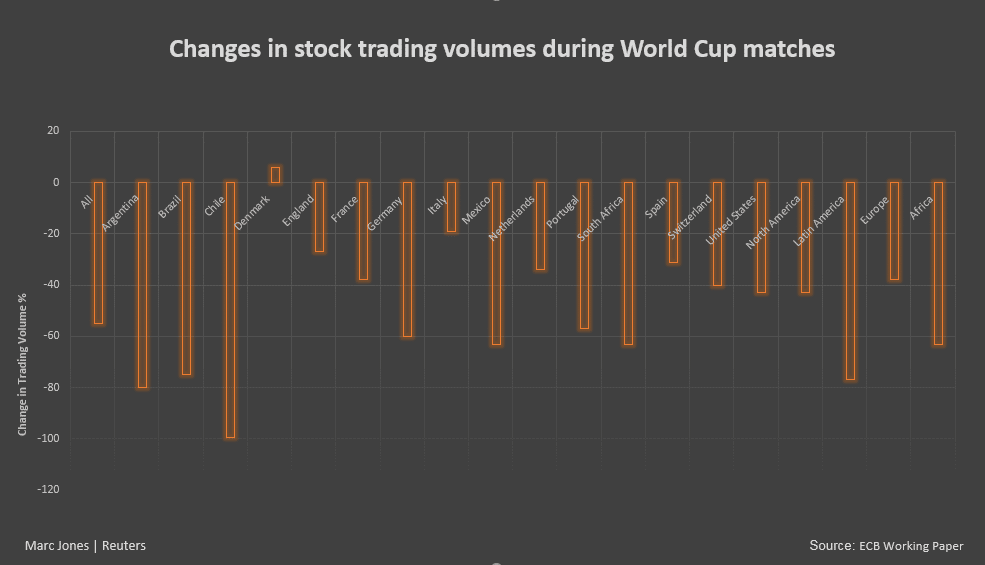
When there is a World Cup, the stats are very clear. In a research paper by Ehrmann & Jansen, during the 2014 World Cup, when a country played during normal trading hours, volumes dropped by as much as 48% in that country’s stock market. On top of it, prices tended to ‘decouple‘ from what’s happening in the global markets.

Below is a good image to show how volumes during the world cup drop (source: reuters).

market volatility during summer and world cup trading

Hence, when your team is playing, local stock market volumes will drop.

On top of it, when your country (or your opponent) scores a goal in your game, the number of trades goes down by 10% and will often take 30-60 mins after the game before trading volumes resume to their pre-game levels.

In this year, more than 2/3’s of the games will be during European or New York trading hours. So expect forex, stocks, futures and bond markets in both Europe and the US to be subdued (less in the US since their team didn’t make it).

And another interesting fact – your country getting knocked out of the World Cup can knock off almost 50 bps from your national index that day, while your country winning the World Cup translates into your country’s index outperforming the global benchmark by 3.5% on average, so some potential trading opportunities on both sides there.

How Trading This Summer Is Different (Trading Insight #2)

Unlike many previous summers, trading has taken on a different tone because of the events happening globally. A trade war between China & the US has spooked global markets (i.e. risk off), and the emerging market space (EM) has been quite volatile while the DM space (developed markets) has been much more muted.

You’ll notice in our members daily trade ideas, we’ve often been holding positions or doing our price action analysis moreso outside the majors simply due to DM volatility being low while EM volatility has been high.

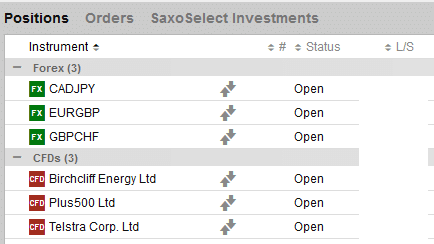
Below you can see my active open positions with none of them being a major.

chris capre's current open trades

Hence I’ve been taking advantage of the increased volatility in the EM markets & crosses to capture these large moves and changes in the price action.

With that being said, how can you use this information to help adjust your trading strategies?

Summer Trading Tip #1

With decreased liquidity as a whole, markets tend to move less. Hence you have to expect trades to take more time to play out. 

Thus try to be a little more patient with your trading hold times as they may simply take more time to get to your target.

Summer Trading Tip #2

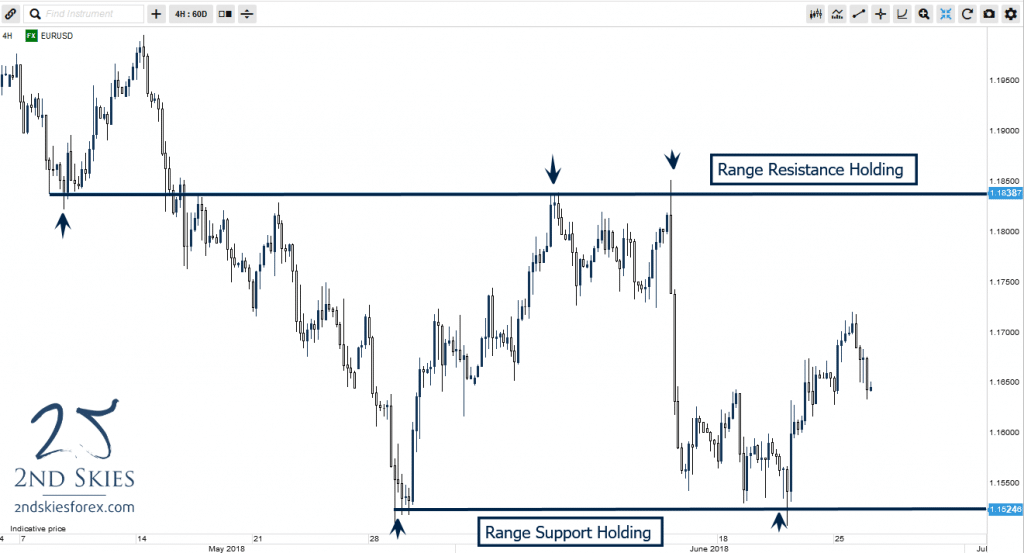
Along with tip #1, expect ranges to hold more, and trading breakouts to work out less during these periods.

range price action 2ndskiesforex

When ranges hold, and liquidity is less, I avoid trading breakouts because many will fail.

Instead, I often look for false breaks which become more common during lower liquidity times, so make sure you’re watching for potential false break setups.

NOTE: If you want to learn more about false break setups, watch my video of me doing a live false break trade for +350 pips of profit.

Summer Trading Tip #3

Try expanding some of your instruments to move beyond the forex majors, like looking at the exotics and EM currencies. Some of EM forex pairs I’m watching right now are: EURNOK, USDSEK, USDTRY, USDZAR, USDMXN, USDRUB, and USDPLN.

As for the DM forex pairs, I’m currently most interested in: CAD, AUD, JPY, CHF and NZD pairs (note: 3/5 are commodity currencies).

In terms of the global markets, I’m heavily watching Russian stocks, UST’s (US Treasuries), commodities (gold, Oil), and EM bonds.

If you’d like to learn more about what live trades I’m in at any time, make sure to check in with our members daily trade ideas for updates.

And if you’d like to learn about another summer trading tip, check out another article I did on trading forex in the summer.

Now Your Turn

Did you learn something about trading in the summer? Have new options for finding high quality trading opportunities?

And the toughest question of them all – who do you think is going to win the World Cup?