Tag Archive for: key support and resistance levels

What’s Inside?

  • What is Dynamic Support and Resistance?
  • How I can find Dynamic Support and Resistance in the forex market?
  • What is the Ichimoku Cloud?

In my last article, I talked about how forex traders can find the best key support and resistance levels. This is a critical component to understanding price action trading. But what is less talked about, yet critical for your trading is understanding and finding Dynamic Support and Resistance.

In this article, I’m going to help you understand what is the difference between ‘static‘ and ‘dynamic‘ support and resistance. From here I’m going to talk about why you need to understand dynamic support and resistance, along with give you two methods for identifying and trading dynamic support and resistance.

static and dynamic support and resistance

What is the difference between static and dynamic support and resistance?

When we talked about key support and resistance levels in our last article, you should have noticed a pattern. You should have noticed all those levels were ‘horizontal‘. While many key support and resistance levels are horizontal, many of them are ‘evolving‘, which means they are ‘dynamic‘. Dynamic support and resistance levels, or areas, where the market can pull back into and find support w/o needing to be at a horizontal support or resistance level.

This happens because:

1) The market is evolving, and sometimes buying/selling interest changes in a way that isn’t at pre-designed levels

2) Momentum in trends is dynamic, along with the order flow

Momentum can often be the underlying energy behind trends or movements (kind of like running downhill).

There are other reasons, but the key point is that you get the underlying idea, and can integrate this ‘conceptual knowledge‘ into your trading. We’ll get to this later in the article.

But to summarize:

a) Static support or resistance levels aren’t moving, and are horizontal in nature

b) Dynamic support or resistance levels are moving, and are not horizontal in nature

Now that we know what dynamic support and resistance is, we can move onto the next section.

How I can find dynamic support and resistance in the forex market (or any market for that matter)?

There are many methods to find dynamic s/r, but we’ll talk about two that I prefer to use.

Dynamic Support and Resistance Strategy #1: The 20 EMA

The 20 EMA is one of my favorite choices for discovering dynamic support and resistance as it does a really good job of being ‘balanced‘. What do I mean by being ‘balanced’? So the 20 EMA (exponential moving average) tracks the last closing prices of the candles for the last 20 periods. It gives more weight to the most recent closes (hence why it’s exponential), with less as you go through the series of 20 candles.

Below is a good graphic of how it differs from a ‘simple’ moving average which weighs the data the same regardless of time.
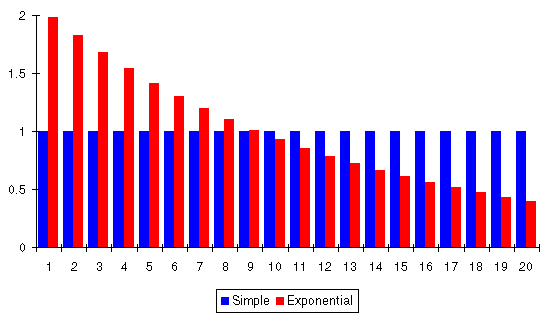
exponential moving average vs simple 2ndskiesforex

EMA’s (exponential moving averages) are balanced (IMO) because it does a great job of detecting the more recent momentum and changes in the price action, while at the same time taking into account some of the longer term movements in the price action, so well placed in between those two forces (hence ‘balanced’).

Below is a 1hr chart on the EURUSD showing the 20 EMA and how the price action related to it.
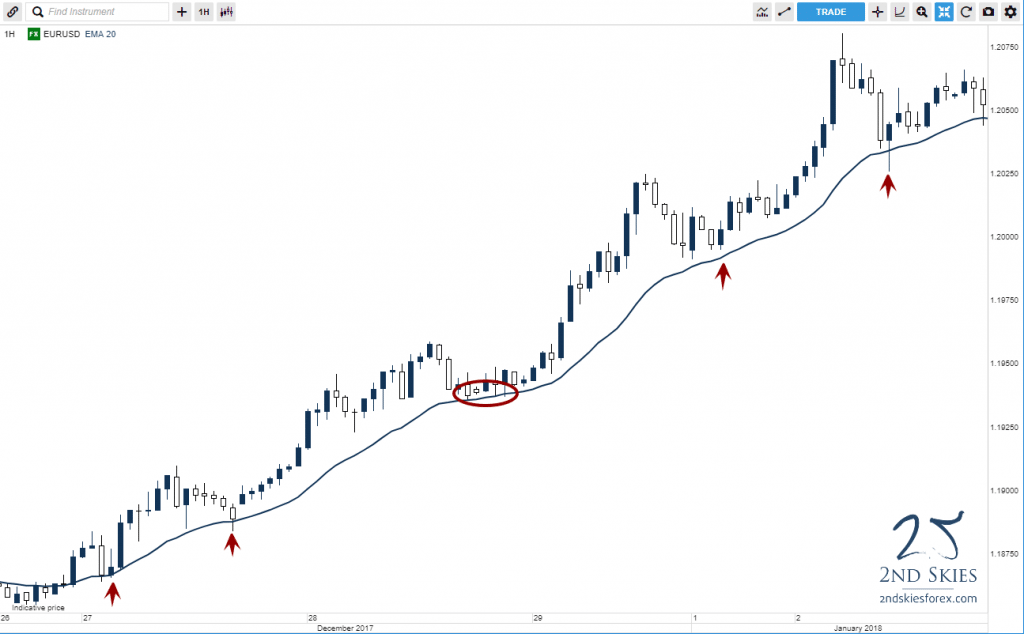
dynamic support and resistance forex market 2ndskiesforex

Notice how the price action touched the 20 EMA several times (navy line) which could have offered you great trade setups to get into the market with trend?

Another example is below on the S&P 500 on the 4hr chart.
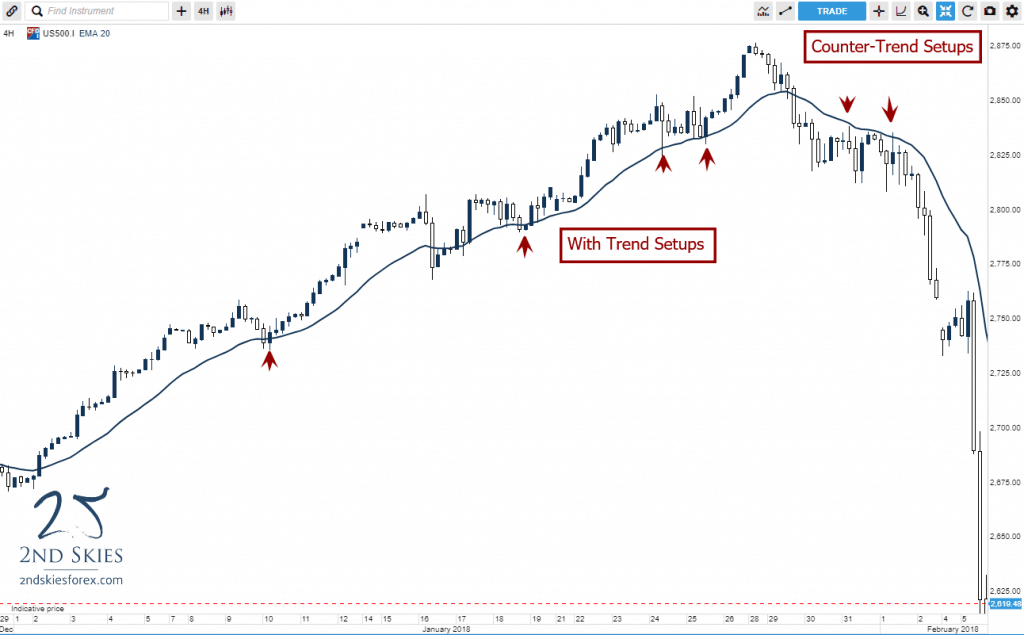
s&p 500 dynamic support and resistance 2ndskiesforex

In this chart of the S&P 500, you can see how the 20 EMA offered some great trade setups both with trend, and counter-trend as the market reversed.

It’s important to note the 20 EMA can act as a solid method for finding dynamic support and resistance on any time frame.

Dynamic Support and Resistance Method #2: The Ichimoku Cloud

In the first 3 years of my trading, I spent the majority of my time learning, studying and trading two strategies:

#1 price action

#2 the ichimoku cloud

If you want to learn about how I trade price action, click here to watch

However for now I’d like to talk about the ichimoku cloud (called ‘ichimoku kinko hyo’) roughly translates from japanese to ‘one glance balanced chart‘. It was created by Goichi Hosada many decades ago. It is one of the most commonly used methods for analysis and trading strategies in Japan, and there are many great ichimoku traders who were considered some of the best analysts of their time (i.e. Hidenobu Sasaki).
ichimoku cloud 2ndskiesforex

To briefly sum up the ichimoku cloud, the goal of this approch is to communicate in one shot (or ‘glance’) the following:

1) what is the trend in the market

2) what is the underlying momentum (or lack thereof)

3) what are future key support and resistance levels

You read that last part right (“future”). One of the primary goals of the ichimoku cloud is to give you an idea where future support and resistance levels will be (and how much there is).

I’m not going to do a whole lesson on the ichimoku cloud. If you want to learn more about the ichimoku cloud and how it’s constructed, click here.

But for our purposes, just understand that the ichimoku cloud measures a) momentum {a form of dynamic support or resistance}, and b) future support and resistance levels.

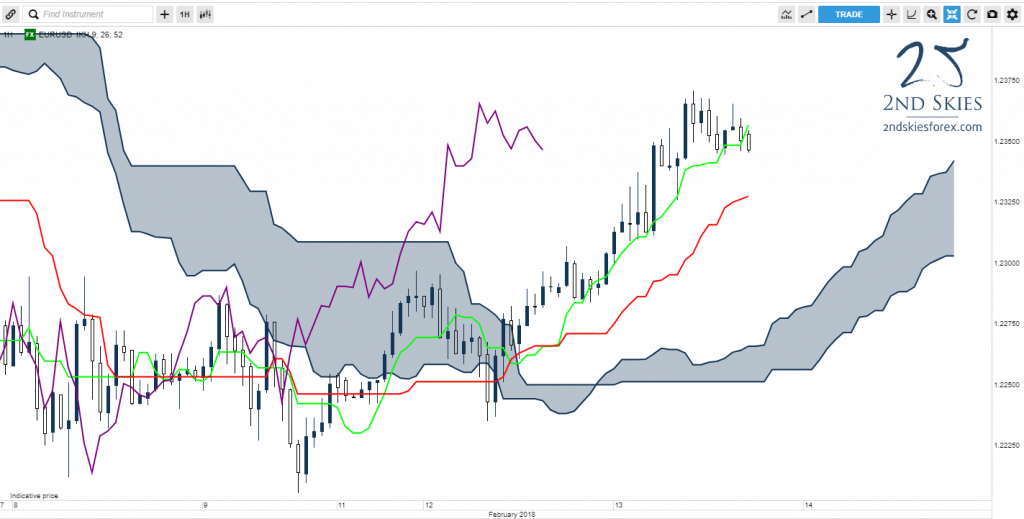
Below is a chart to show you how this works.
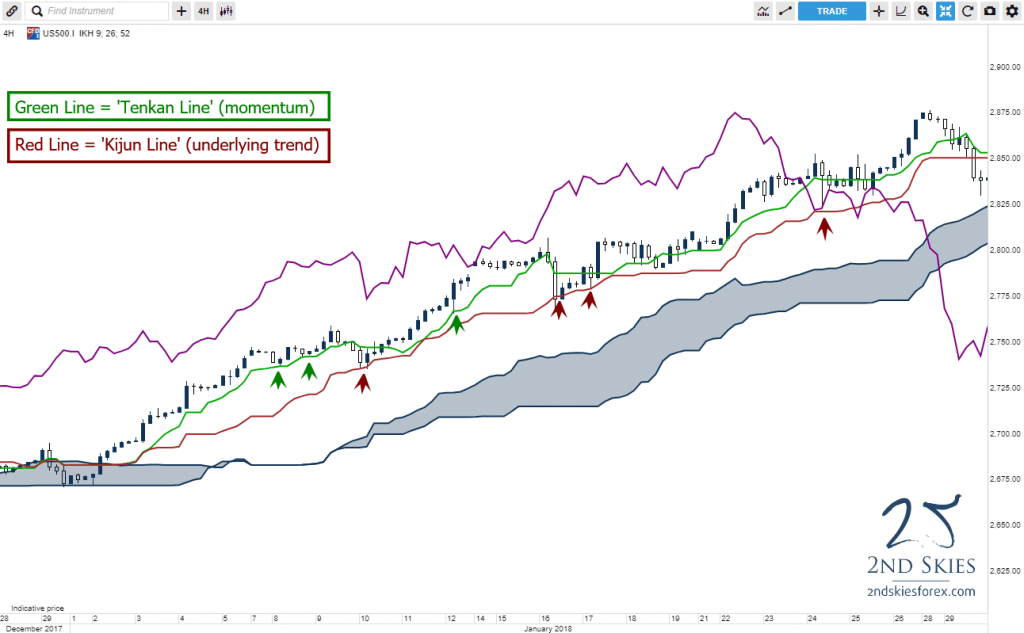
ichimoku dynamic support and resistance 2ndskiesforex

In the above S&P 500 ichimoku cloud chart on the 4hr time frame. There are several ways the ichimoku kinko hyo can act as ‘dynamic’ support or resistance. But for our purposes, in this uptrend, notice how the Tenkan Line (green line) did a good job acting as support on minor pullbacks.

The tenkan line does this well because it’s meant to track the underlying momentum in the price action. If the trend is strong, and has good momentum, the tenkan can often act as support or resistance. If momentum is weak, you’ll see this in the tenkan line by price crossing it more frequently, and not respecting it. This should tell you momentum is ‘weak’ or ‘weakening’ (depending upon the ichimoku context).

You’ll also notice the kijun line (red line) which is supposed to track the underlying trend in the price action. Notice how as price pulled back deeper in the uptrend, it stopped at the kijun several times, offering potential trade setups to get in this with trend.

There are many ways ichimoku is great for helping you find ‘dynamic’ support or resistance, but these are two good methods for now.

NOTE: If you want to learn more about the ichimoku cloud, click here for several free videos on learning more about the ichimoku cloud.

In Summary

While we spent a good amount of time recently talking about horizontal key support and resistance levels, today we’ve showed you how there is a different form of support and resistance which expresses itself as ‘dynamic‘.

We’ve also given you methods for finding dynamic support and resistance, along with showing you how the ichimoku cloud can provide an alternative (and useful) trading method.

Now one thing I forgot to ask is, have you ever looked at a chart and had a hard time finding key support and resistance levels?

Usually when I look at the price action on a chart, and I find it’s pulling back to areas where there doesn’t appear to be any support or resistance, I often try to see if the market is respecting ‘dynamic’ levels vs horizontal ones. Often times when I do this, the chart becomes more clear as this change in perspective gives me new trading opportunities I was missing before.

If you’d like to learn more about the ichimoku cloud, don’t forget to check out my ichimoku trading course. And if you want to learn more about forex dynamic support and resistance, take a look at my price action course.

Now Your Turn

Have you had this experience of not being able to find key dynamic or static support and resistance levels, or why the market pulled back to where it did? What did you learn about forex dynamic support and resistance levels from this article?

Make sure to leave your comments below, along with ask any questions you have on the subject. And don’t forget to tweet/like this article on your favorite social media so others can benefit from it.

Until then, I’ll look forward to hearing from you.

What’s Inside?

A key topic that orbits around price action trading is “how do I trade with candlestick wick patterns in the forex market?” The problem with this question is it comes with some misunderstandings about price action, order flow and what wicks really communicate.

The goal of today’s article is to give you a new perspective on trading price action wicks that most ‘internet gurus‘ won’t tell you. It is to give you an understanding of candlesticks, what they communicate and how to relate and trade them.
Understanding Candlesticks

We’ll give you this understanding and how to trade with candlesticks through 4 key points on forex price action wicks.

But before we get into trading wicks, we have to understand the foundation of where our approach comes from.

Key Point #1: The Difference Between Price Action & Candlestick Trading

I approach trading from a particular perspective that a) order flow is the proximate driver of price action, and b) all activated orders in the market are based upon ‘information‘.

NOTE: If you want to learn more about how I trade price action context, click here.

But to simplify it, trading price action ‘context‘ is trading the overall ‘structures‘ or ‘Gestalt‘ of the market. And you cannot get this through 1, 2 or 3 candles.

price action trading-sp500-sep-22-2ndskiesforex

People who trade based upon 1, 2 or 3 candlestick patterns, such as pin bars, or fakey’s, or engulfing bars are candlestick traders.

Fun Fact: The fakey pattern or setup, is really called the Hikkake pattern, given that name decades ago, which today many forex ‘gurus’ have renamed to make them sound like their own.

Regardless, candlestick pattern traders are not ‘price action traders‘. They are ‘candlestick traders’. Essentially, candlestick pattern traders believe 1, 2 or 3 candlesticks define the price action context and order flow in the market, and thus give you trade setups.

But ask yourself, why do many key support or resistance levels hold without a pin bar rejection. Why would it do that if the pin bar is such a superior tool for recognizing and ‘confirming‘ whether the key support or resistance level will hold? Why do banks, hedge funds, and prop traders place orders at particular prices well before a pin bar has ever formed, and not based upon the New York close daily charts?

NOTE: If you want to learn why a typical pin bar entry is a retail entry, click here.

When you start to ask these questions, the foundation for trading pin bars and candlestick patterns breaks down. That leaves you with trying to understand the underlying order flow in the market. And you do this by learning to read and trade price action context.

This is how we approach the market.

Now that we have this foundation, we can move on to how do we relate to forex price action wicks (or any wicks)?

Key Point #2: All Wicks Are Rejections of Value

When you look at the essence of what a wick represents in terms of the price action and order flow, you come to the conclusion that all wicks are a communication. They communicate that the order flow was rejecting that pricing and value.

If the market accepted it, it would close there, and remain there.

However, there is a ‘but’ in there. The ‘but’ is while wicks in the forex market = a rejection of value, they are not for defined periods of time or defined moves in pips.

What I mean by ‘not for defined periods of time‘ is a) beyond the close of their candle, and b) they are not going to define how long the market will reject that move or value from that moment forward.

What does give you this information? Price action context.

The goal of price action context is to give you a ‘probabilistic framework‘ for what the market is more likely to do. Wicks will not give you this information, nor give you a probabilistic framework for how to trade this.

Hence you have to come back to price action context.

price action context 2ndskiesforex

The most essential point to understand here is forex price action wicks (or any wicks) = a rejection, but we cannot understand how that rejection will manifest, so we have to take these as a grain of salt.

What this also means is that 1, 2 or 3 candlestick wicks will not ‘confirm’ a rejection of a specific kind (which is what we want if we’re going to trade said ‘confirmation’ or rejection).

If you want to understand why confirmation price action signals will crush your account, click here.

Key Point #3: Opening And Closing Of Candlesticks Do (And Do Not Matter)

Wait a minute, how can the opening and closing of candlesticks ‘matter’ and ‘not matter’? Let me explain.

In very ‘particular’ circumstances, the opening and closing of candlesticks will matter. Such as:

  1. if you are trading some sort of ‘opening’ gap strategy
  2. if you are trading specific types of breakouts
  3. if you are trading specific candlestick patterns

candlstick wicks rejection 2ndskiesforex

There could be a few more circumstances, but by and large, the majority of time, the opening and closing of candlesticks do not matter.

What matters more is order flow and price. This is why most institutions, hedge funds, and prop firms know their price ahead of time, regardless of the close. They know where they want to get in, and where they want to get out, regardless of the candle being open or closed.

Hence the opening and closing of candlesticks matter, but on a limited scale.

Key Point #4: How Do You Trade Forex Price Action Wicks?

There are many ways I relate to forex price action wicks (or any wicks) in my trading, but I’ll give you a couple wick trading strategies below.

Trading Strategy For Wicks #1: With Trend Wicks Will Be More Reliable (or ‘probable’) Trading With Trend vs Counter Trend

If a wick represents on a base level some sort of ‘rejection’, which side is most likely to ‘reject’ the price or value? The with trend players, or counter trend players?

With trend is the answer. With trend players are more often controlling the market and order flow, so they’re more likely to reject a price effectively cause they’re largely in control.

I personally like seeing with trend rejections on pullbacks heading into a level because they are showing a more ‘probabilistic framework’ of order flow in the market.

Below is an example of a good chart showing this on the USDCAD 4hr chart.

forex price action wicks holding with trend 2ndskiesforex

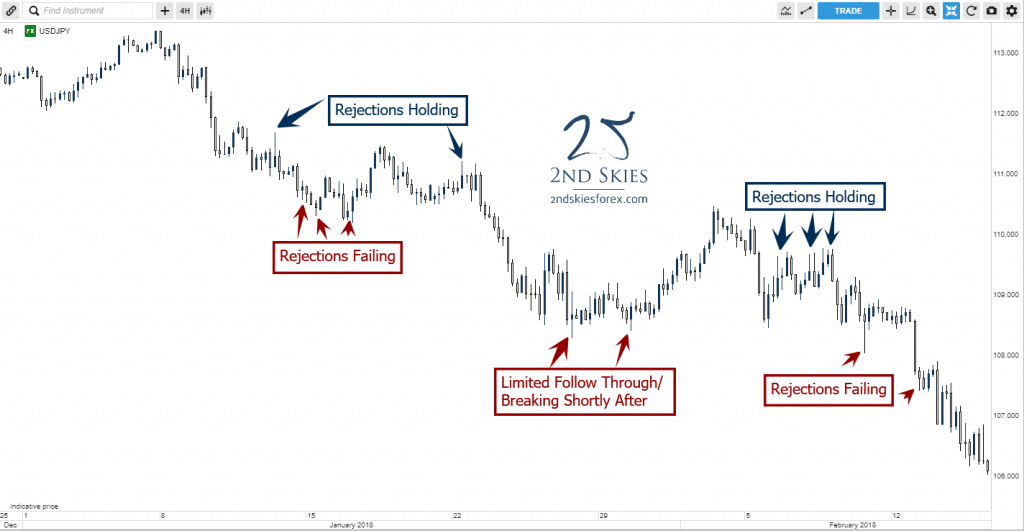
Notice how the majority of the wicks and rejections with trend hold, while the counter-trend rejections fail?

Below is another good example of a chart on the 4hr USDJPY chart.

forex price action wicks holding with trend v2 2ndskiesforex

Hence when trading, if you are trading with trend, wicks rejecting price in your favor make your trade more ‘probable’, while trading counter trend are less ‘probable’.

If you wan to learn more about trading with a probabilistic mindset, click here.

Trading Strategy For Wicks #2: Clean Wick Rejections Off Key Support or Resistance Levels Are Best

What do you mean by a ‘clean’ rejection or wick off of a key support or resistance level?

While I relate to support and resistance as ‘zones‘ of order flow, sometimes they line up super well to where you can clearly see price is rejecting off a very specific price and value.

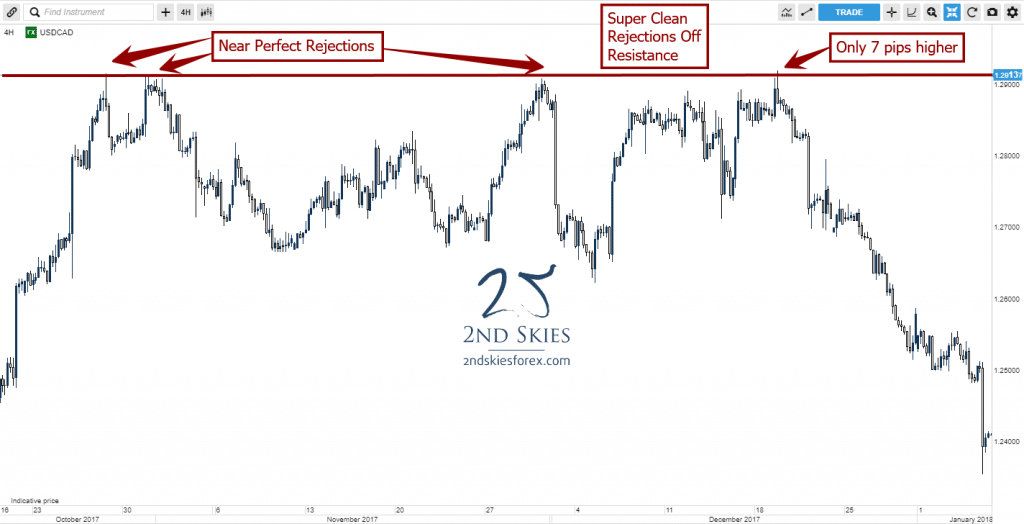
Case in point, take a look at the USDCAD 4hr chart from mid-October last year to mid-Jan this year (~3 mos).

super clean rejections wicks off of resistance 2ndskiesforex

You can see in the chart above, the price action rejected off of the key resistance level near 1.2913 six times in a 3 month period with almost every rejection happening within a few pips of each other, and the biggest break being only 7 pips.

When price rejects very ‘cleanly‘ off of a key support or resistance level, they become more ‘probable‘ of a legitimate rejection.

Not all charts and key levels will look like this, but they do often in many price action structures, and can be good for building your ‘probabilistic framework‘ for understanding price action context and the order flow behind it.

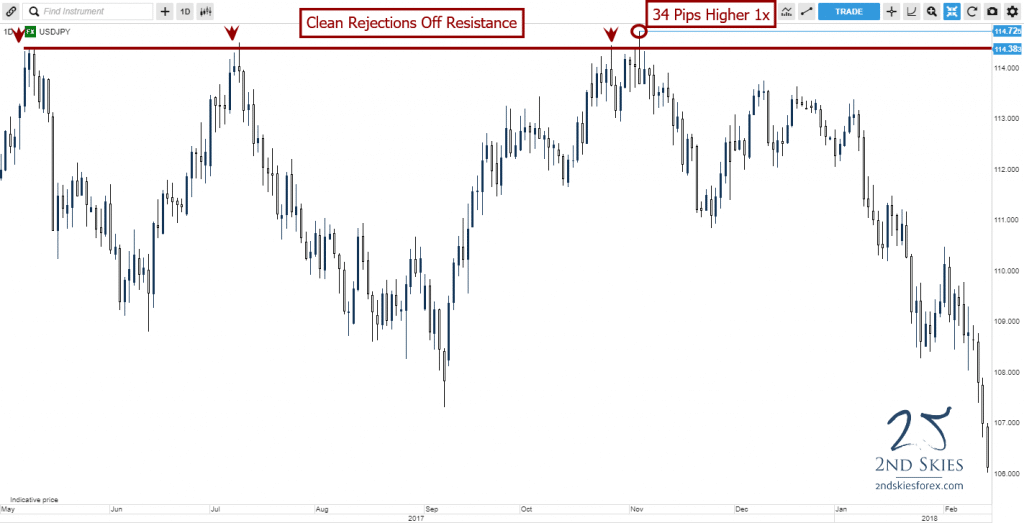
You can see another example of this below with the USDJPY daily chart.

clean rejections wicks off of resistance 2ndskiesforex

Notice how 3 of the 4 rejections were almost at the same price with only one breaking by a small amount?

There are many other ways to understand wicks and rejections in the price action, but these are two good methods to work with that I use personally and trade profitably with my own money.

In Summary

Forex price action trading wicks (or wicks in any market) are important to understand, particularly from the perspective of order flow and price action context. Wicks ‘communicate‘ at a base level ‘rejection‘, but they do not by nature determine any rejection to follow through.

However there are ways you can use wicks in your trading price action, particularly the two methods I mentioned:

  1. with trend wicks add to your ‘probabilistic framework’ better than counter trend wicks
  2. clean wick rejections off of key support and resistance levels also add to your ‘probabilistic framework’ for trading

Now Your Turn

What did you learn from this free trading article? Do you feel you understand candlestick trading wicks, rejections and how they work in forex applications?

Make sure to leave your comment below, along with share this via Twitter or Facebook with those you think can benefit from this.

Less than two weeks ago, a course member asked me the following question (click to enlarge):

2008 crash

Here was my response:

“You have to be prepared for bigger pullbacks & volatility than usual. You have to keep staying short till you see a broad base of instruments bottoming and showing a transition in the price action and order flow” – from my members coaching session Feb 14th.

This week, we got a taste of this volatility, and there is a decent chance the selling + volatility may just be starting. Hundreds of my clients and friends have been asking me, “Is the stock market about to crash?”

In this trading article, I’m going to discuss the coronavirus, the increase in volatility, what’s happening the financial markets, is the stock market going to crash and how I’m trading it.

So grab the popcorn and a good beer as we’re going to get into the thick and thin of it.

Coronavirus + Volatility = Panic!

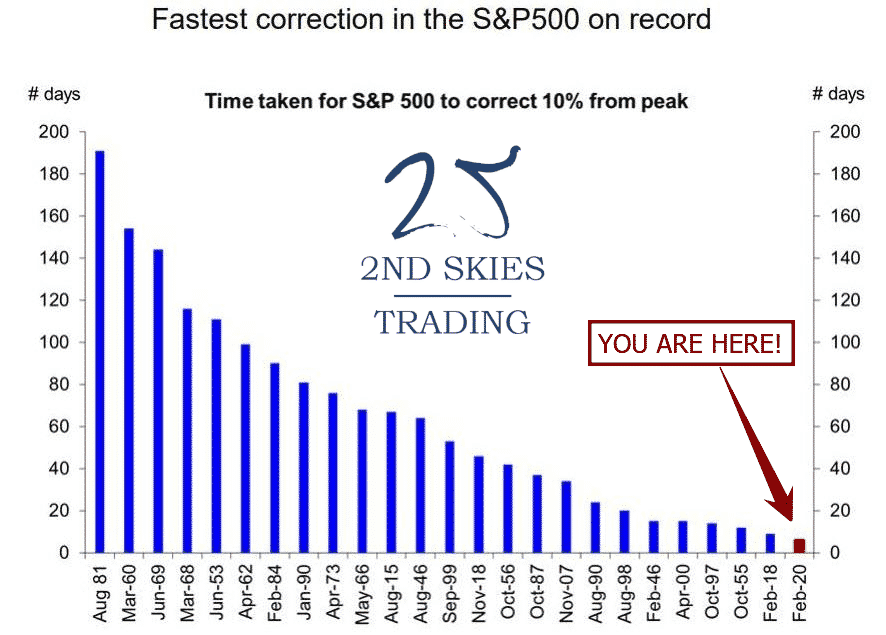
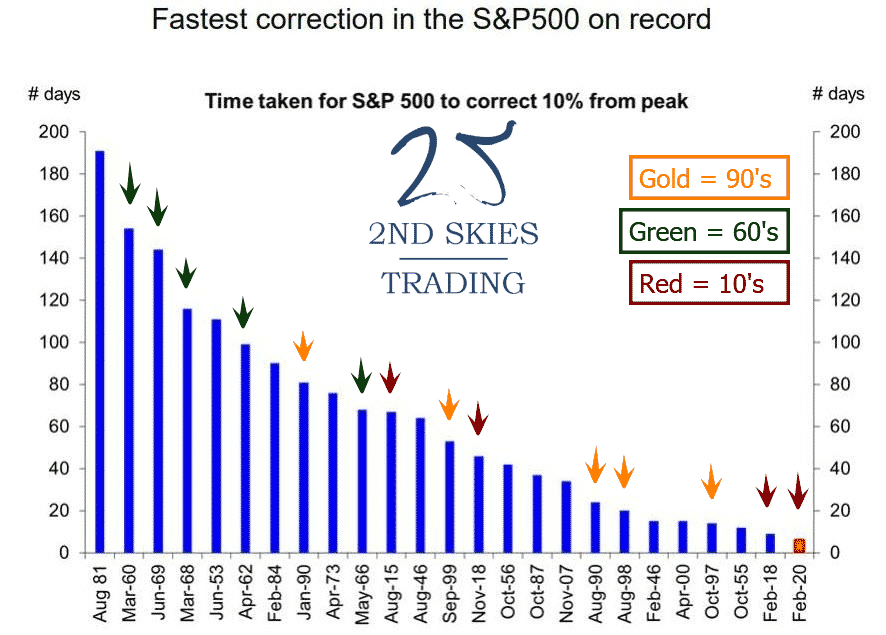
Let’s get into some stats around this week’s incredible sell off in the global markets. This week’s drop in the S&P 500 was the fastest 10%+ drop IN HISTORY!

Exhibit A: The Fastest Correction (10%) in History (S&P 500)

fastest correction S&P 500 in history 2ndskiesforex

In the last 7 trading days starting with February 20 – 28 (from open to close) lost 440 points shedding 12.9% while global markets puked $5 trillion in market cap.

Translation: In the last 7 days, we lost the GDP of the UK & India combined! (source: investopedia)

Also of note, the fastest and second fastest 10% declines (from peak) have happened within this decade.

Of all the decades going back to the 40’s, the 60’s and 90’s had 5 of the fastest 10% corrections in history. This decade is in 2nd place with 4 of them (see below)

fastest corrections by decade 2ndskiesforex

Also of note is 3 of the last 5 of these fast 10% corrections have happened in the last two decades and 7 out of 10 in the last 30 years.

Translation: these corrections are happening faster in more recent history than before.

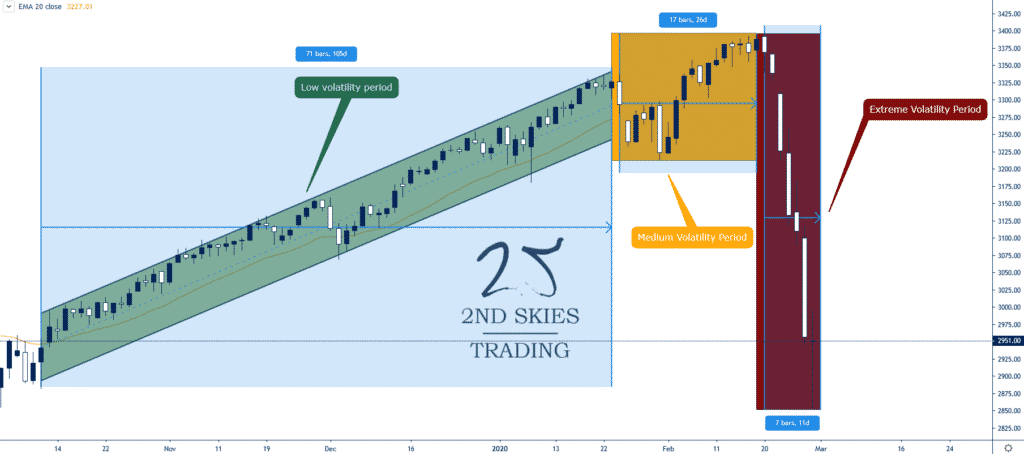
What is also important to note is how low volatility was in the S&P 500 until the corona virus started to become prevalent in the markets (see below).

volatility ranges S&P 500 2ndskiesforex

We had 71 days of super low volatility and many 5 day stretches where the markets never dropped more than .5% (green box)

Then we had a period of 17 days with mildly increasing volatility when the coronavirus was becoming more of an issue.

This culminated in a 7 day explosion of volatility last week erasing months of gains in a flash.

This is one of the most important trading lessons I’ve learned over 20 years. That markets can and often do sell off faster than the run ups.

The reason why this can happen has to do with market psychology and behavioral finance.

In a long bull trend, the general emotions are complacency, confidence and greed. This has to do with simple biology.

We are wired as humans to react more rapidly to stimuli which threaten our existence. Slow non-volatile bull markets don’t threaten us, so we don’t often react with alacrity at a small sell off.

The emotions behind a bear market or extreme selloff is fear, worry and panic. Hence a sharp selloff and quick loss in our portfolio is threatening, thus leading to fast reactions (SELL & SELL EVERYTHING!).

This is why markets can sell off far more quickly then on the way up.

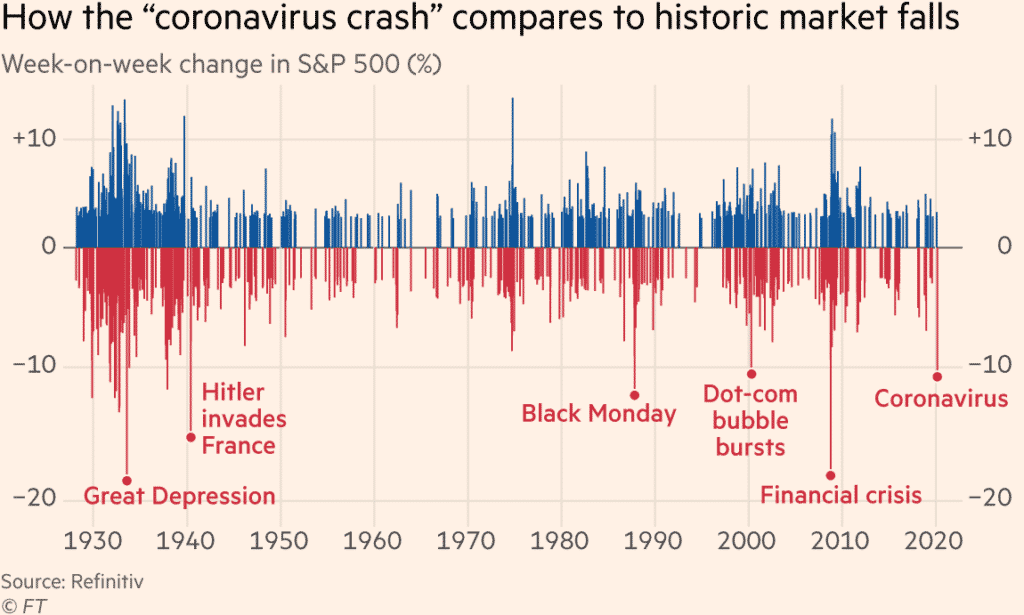
There is a reason why the fastest week-on-week changes in the S&P 500 (%) are during crashes vs bull runs (see below).

fastest week on week moves S&P 500 2ndskiesforex

The big moves to the downside (week-on-week %) are simply larger and more frequent.

This also means big week-on-week changes create a feedback loop for panic selling to continue.

What this means for investors and traders is we make quicker trading decisions during bear vs bull markets.

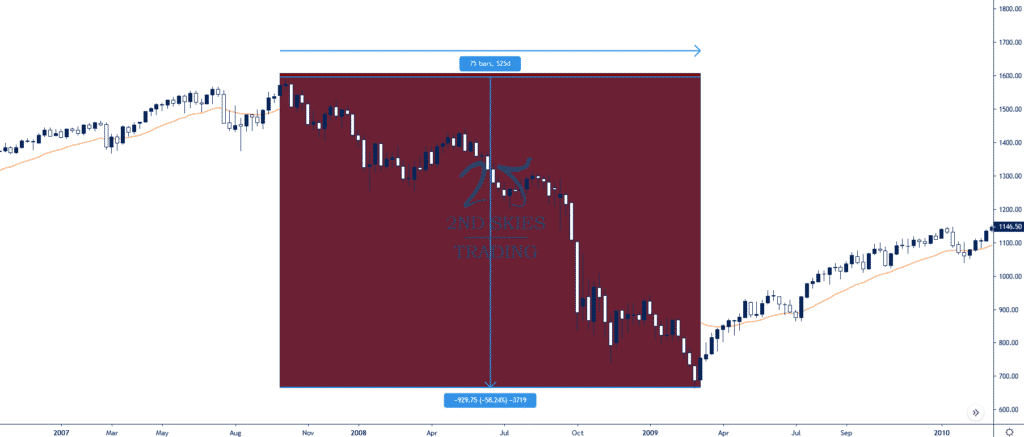
Now in comparison to the 2008 financial crisis, the S&P 500 lost 58% from Oct 07’ – Mar of 09’ over a period of 525 days peak to trough (image below).

2008 sell off S&P 500 2ndskiesforex

We’ve already lost 12.9% (about one-fifth of the 08’ drop) in just 7 days!!!

And if we happen to get another 58% decline, we’ll be looking at an S&P 500 around 1400 by the time this is over.

Translation: this selloff has the potential to be one of the most rapid declines in history. And the speed at which we’ve lost so much so fast last week could create more selling from investors globally.

Going from a low volatility environment to a high one this quickly will create stronger biological reactions, hence the formula Coronavirus + Volatility = Panic!

Is The Stock Market Going to Crash?

Short answer: I don’t know. I don’t think we’re there yet.

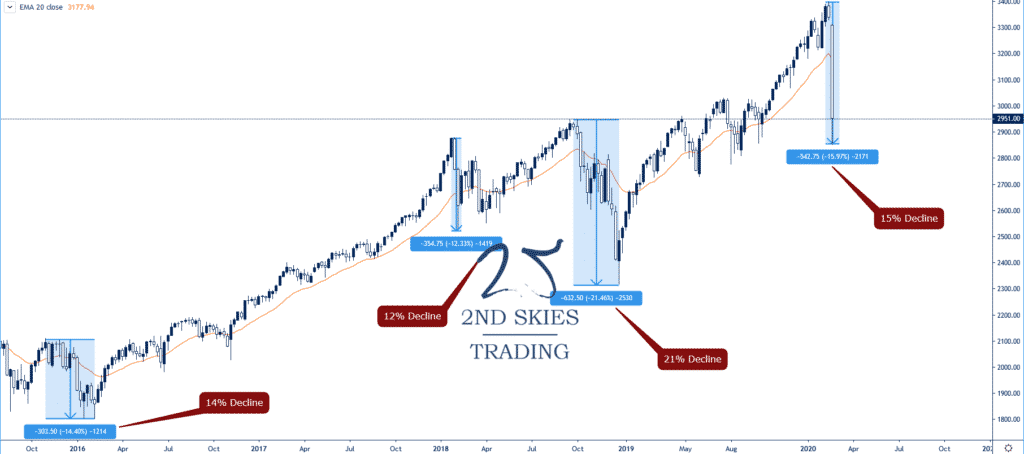
We’ve had many 12+% declines in recent history (4 total) since 2016 with a 12.33% decline (Jan 18’) being the smallest and a 21.46% decline the largest (Nov 18’).

recent declines S&P 500 2ndskiesforex

I think once we start seeing a 25% drop or larger, investors along with major institutions (Fed, Trump Admin) will start to really panic.

Combine this with the fact we’re in an election year and the last thing Trump wants is a stock market collapse.

In some sense, it’s even a bigger issue for Trump as he campaigned on his business skills, and has proudly taken credit many times about this being the “Greatest Economy Ever” pretty much anytime we’ve posted all time highs over the last few years.

Should we get a strong selloff next week and start reaching the -20% levels, expect a govt stimulus to come which (depending upon how its setup) could create a short term strong bounce.

But here’s the kicker…

Let’s say the coronavirus continues to spread from country to country with more and more population centers becoming infected.

Is a Fed rate cut going to inspire you to travel? No.

Will a Fed rate cut give you the confidence to go out in public and risk getting infected with a potentially deadly disease? No.

And this is how this threat to the markets is different than the 2008 great financial crisis.

The 08’ crisis was an economic one (over-leveraged exposure to housing) which was able to spread globally.

The coronavirus isn’t an economic issue, it’s a biological and containment issue.

Economic policies will be more effective (like in 08’) simply because it was more of a 1-1 relationship (economic problem & an economic solution).

However, economic stimulus isn’t going to change a biological health scare because the relationship isn’t a 1-1 match.

My sense tells me economic stimulus packages will be far less effective vs the actual biological and crisis management of the issue.

That is where IMO traders and investors globally should be looking for signs of a turnaround should this selloff get worse.

We haven’t gotten to the ‘Oh-Sh!t’ levels yet. Once we start to get into a 20-25% decline, then I think you’ll start to see real panic in the markets.

How to Trade & Protect Your Long Term Investments During This Time?

I wouldn’t think of buying anything till at least we see the market open this week.

How the Asian markets open will likely give a strong tell as to how the week will go.

Hence before you go rushing into what you think might be ‘cheap’ prices compared to recent history, wait to see how the market opens.

We’ve only had a few instances of the markets selling off for 3 weeks in a row since Dec 15’ (5 total) and none of them shed this much value.

For now, there are various ways you can protect your long term long term plays if you think there is more downside:

Trading Options

1) collect premium by selling calls on stocks you are holding long term

2) bear put spreads

3) buy outright puts on your long stock positions

Trading Forex

The currencies which have most benefited from this 7 day decline are JPY, CHF, EUR & USD while EM currencies suffered heavily (MXN, RUB, ZAR).

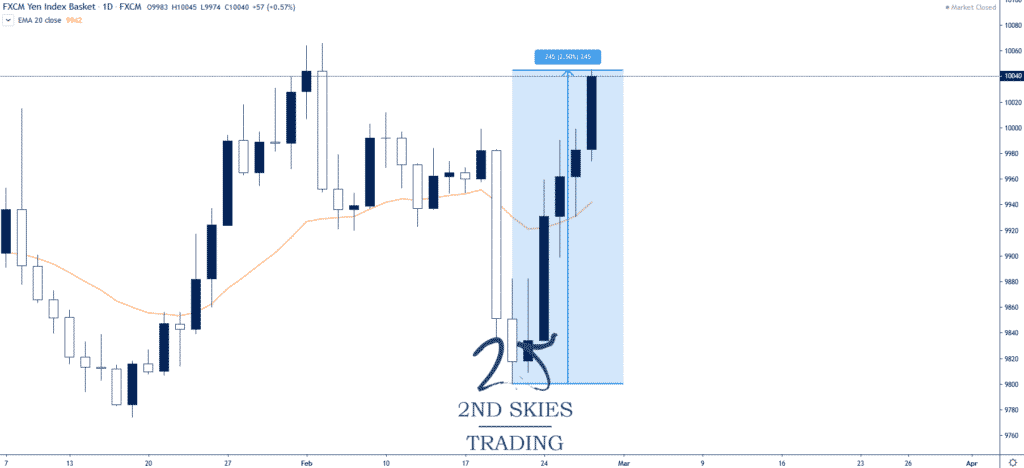
The JPY basket (JPY vs USD, EUR, GBP, CAD & AUD) gained 2.5% last week (image below).

jpy basket 2ndskiesforex

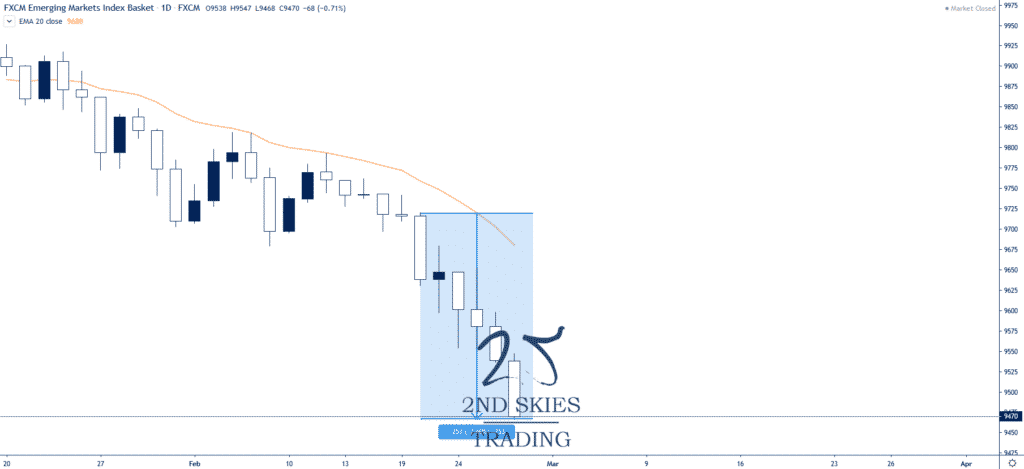
Meanwhile the EM basket (USD vs CNH, MXN, ZAR & TRY) lost 2.6% over the same period (image below).

em basket 2ndskiesforex

The EM currencies which suffered the most losses last week were MXN vs EUR (-9%), RUB vs EUR (-8.8%), RUB vs JPY (-9.5%), MXN vs JPY (-9.6%), CHF vs MXN (9.5%), & the CHF vs RUB (8.8%).

If the virus continues to spread, expect further capital to move into these safe haven currencies vs EM betas.

It’s important to note many of these currencies ran into some key support & resistance levels, rebounding a bit to end the week.

Forex currencies tend to overshoot key levels during major crisis, so if we see them blow past many of the current key support & resistance levels, we could be reaching all time highs or lows (EURZAR, USDRUB, USDMXN) on the quick.

I’ve been trading many of these pairs on the 5 minute charts trading intraday breakout setups with two positions.

I’d suggest using the first position to hit a medium term target while letting the second one run and capture as much alpha as possible till momentum changes manifest in the short term price action.

But this is only recommended if you are doing day trading.

Trading Stocks

If you feel an uncontrollable urge to buy stocks, I suggest the following plays:

Watch the market leaders who exhibited strength heading into the selloff and performed well on Friday. If they continue to exhibit strength, there may be a potential buy, but watch the price action:

1) Microsoft (MSFT) which gained 7.7% on Friday

2) Facebook (FB) which climbed 6% on Friday

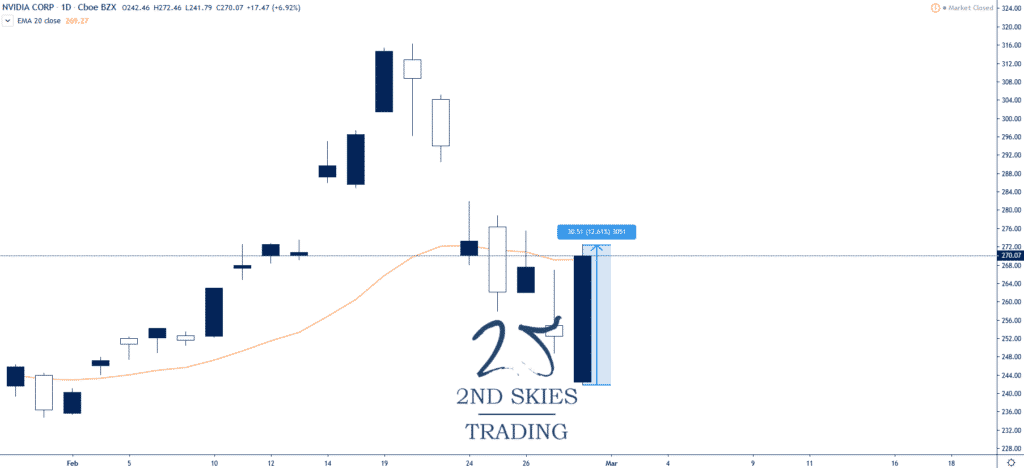
3) Nvidia (NVDA) grabbing a 12.6% gain to end last week

nvidia stock trading 2ndskiesforex

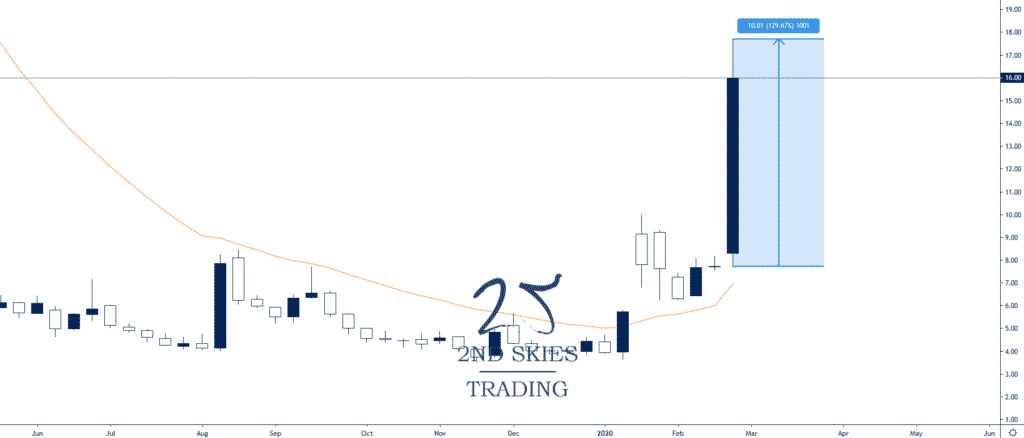
4) If you don’t mind trading nano, micro and small caps, take a look at pharma stocks which have done well recently: NVAX +129% low to high last week, MRNA +96%, and for the truly brave micro cap trader CODX +591% last week low to high (big cajones required 😉)

Novavax (NVAX) chart below:

novavax stock trading 2ndskiesforex

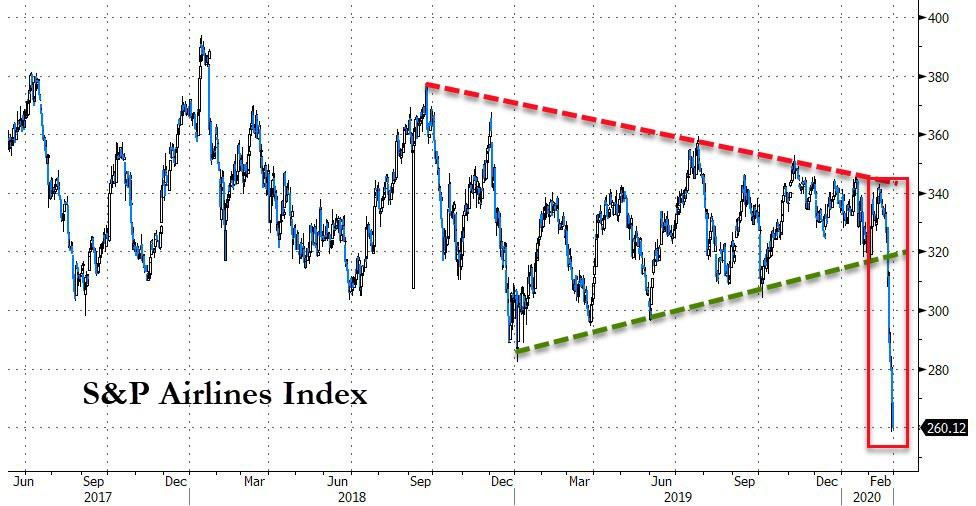
1) Sell Airlines (who wants to fly to another country when there’s an outbreak?) – source: bloomberg

NOTE: A more targeted method would be going after airlines in countries where travel bans or warnings are issued.

sp500 airlines index 2ndskiesforex

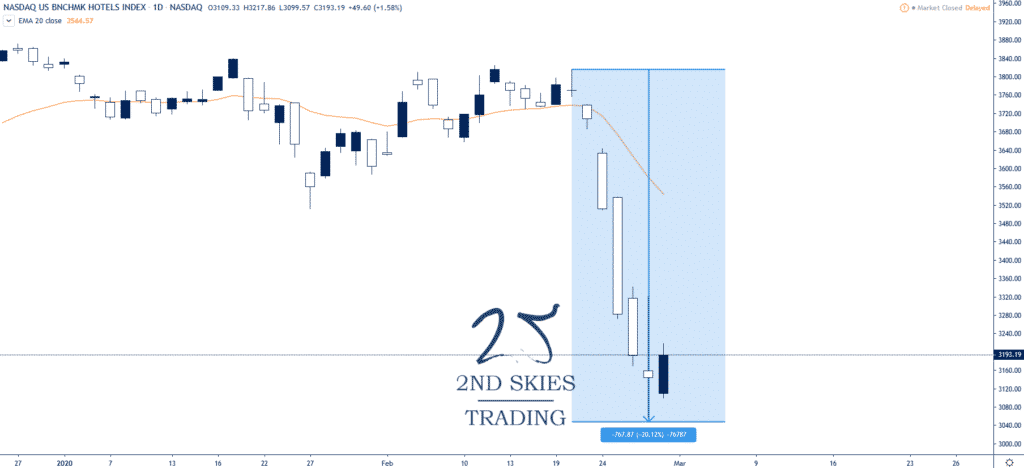
2) Sell Hotels/Entertainment which is down 20% on the week (same reasons as above)

us hotels benchmark index 2ndskiesforex

There’s been a lot of profit taking in commodities, so I’d wait for a change in the short term price action context before getting long (gold and silver in particular).

Wrapping It All Up

Now is not the time to be listening to CNBC analysts, most of whom are not trading. Last week many were all calling stocks ‘cheap’ and in the process getting their a$$’s handed to them.

This is a time to be alert and nimble, using good risk management as the volatility moves on these instruments can wipe out weeks or months of gains if you’re not careful.

Hence trade smaller positions than your usual risk % per trade. Try more ‘proof of concept‘ trades where you put small feeler trades out, and if it progresses, then add on size.

I don’t think the stock market is at its ‘OH SH!T‘ moment yet, but we could get there fast.

I’ve traded now for 20 years and went through 2 major financial crisis (2001 dot.com bust & the 2008 great financial crisis).

The first one I didn’t know what I was doing and performed poorly.

The second one I learned my lesson and killed it.

Traders can make a lot of money if you’re smart and agile, defensive when you need to be and aggressive with precision.

But you’ll need mental toughness to manage your emotions and mindset during these periods.

Do that and you can make a killing. You may not see another time like this for years as its been over 12 since the GFC of 08′.

Hence, avail yourself of the opportunity, be patient, allow for more space in your stop losses due to the increased volatility, and trade with the most impulsive moves till you see changes in the price action and order flow across a broad base of instruments.

******

This was a monster article that took hours upon hours to write and publish. Please make sure to pay it forward by sharing it with others on social media and leaving your feedback below.

Until then, good luck trading and I’ll see you out there in the field.

One of the most important trading, technical and price action skills you’ll need in forex trading, stock trading or trading any major market, is the ability to draw and find key support and resistance levels and zones. Make no mistake, this is a trading ‘skill’ you’ll need to build.

One of the biggest questions I get is “how do I draw and find support and resistance on my chart?”

In today’s free trading lesson, I’m going to share with you 5 tips on how to draw support and resistance so you can learn to find the best levels for your trading.

Do you want a FREE practice trading account?

Make sure to sign up via our preferred multi-asset platform below (certain country restrictions apply): https://2ndskiestrading.com/xtb-demo/

Want to get my Price Action Course for FREE? Click here to find out how: https://2ndskiestrading.com/xtb/

⏰TIMESTAMPS⏰

0:50 – Support and resistance levels without the price action context is…

2:17 – why you want to draw the most important levels (and not go cray-cray with your s/r levels)

4:03 – do you draw your support and resistance levels using the wicks, or the bodies of the candles?

6:27 – why you need to think of support and resistance in a different way

9:59 – levels respected in this way will always be much stronger

Read more

key support and resistance levels chris capre 2ndskiesforex

Today I got a question from a student who’s only made a few posts in the course, so just getting started.

They asked a question which points to a critical aspect of trading.

Here is what they asked below:

questions about trading support and resistance


I think this is a fantastic question many developing traders struggle with.

How do you ‘know’ if the key level you’ve chosen is the right one?

What happens when the level you chose just got sliced through like Swiss cheese?

And do I look for ‘confirmation’ whether this key level will hold or not?

I’ll address these questions in this article to clarify your understanding of trading with support and resistance levels.

Isn’t Finding Key Support & Resistance Levels Subjective?

I think many beginning traders struggle with the more ‘discretionary’ elements of trading.

It’s easy to want things to be fixed, to be purely scientific or mathematical. That is nice because it means for every situation x comes up, you should do y.

Lamentably, trading isn’t that simple, especially when trading price action. Risk management would be one of those components of trading which is purely scientific. It all boils down to math and the risk of ruin.

risk-of-ruin-formula 2ndskiesforex

However, trading key support and resistance levels is part scientific and part artistic. This means there are rules to trading them, but part of working with them will entail a ‘discretionary’ call.

Hence the answer is yes, there will be a part of your trading with key levels that will be subjective which you cannot avoid.

It should be noted I do not look at support and resistance levels as pure lines in the sand. I look at them as zones of order flow.

Why do I say this?

Because when you look at the order flow and liquidity around key levels, you’ll notice a pattern. That orders and liquidity vary at several prices above & below the key level.

order flow liquidity price action 2ndskiesforex

This is because there are varying institutional players out there who will place their orders at varying prices above or below any key level.

A great example of this is when we consider time horizons for trading. If someone is trading intra-day, then they will likely have a smaller stop.

This will require them to have greater precision in terms of their entry price and trade location. Thus they will be as close to the level as possible.

However someone who is swing or trading long term will not be so concerned with this as a few pips difference on a +500 pip profit target and 150 pip stop loss.

Keep in mind, this is just ONE factor regarding how orders are placed around key levels (as there are many).

But when we look at the order flow around key support and resistance levels, we can see there are going to be orders at many prices above and below a key level.

This is part of the reason why I consider trading key levels to be more like zones of order flow. There are other reasons which I explain further in my price action course.

How Do I Know The Levels I Selected Are Key Levels?

This is another critical question that I often see amongst developing traders. The reason why I say ‘developing‘ traders is because this type of question & wording gives a unique insight into a traders mindset.

They make it seem  like placing a trade around a key level is like jumping off a cliff that is only 15 feet above water 😮

jumping into water

As a general rule, you will never ‘know‘ anything about trading, let alone price action. This isn’t like poker where you have a fixed number of cards in the deck and can ‘know’ the probability of a hand or card being hit.

There are an infinite amount of possibilities -1 that can happen in the charts. You will never ‘know‘ with 100% certainty and you cannot avoid this.

The desire and want to ‘know‘ comes from a beginning traders mindset…of wanting pure objectivity in trading.

“Beginning traders want certainty because they are uncertain of their abilities and skills.”

The want for certainty is an attempt to compensate for their lack of skills and confidence. The problem is, certainty is an illusion in trading, so you are wanting something that does not exist.

I do not ‘know‘ a key level I’ve chosen will work or not. I’m just going on probabilities & my read of the price action context.

I’m guessing an olympic biathlon shooter doesn’t ‘know’ when the wind will blow. But they can take measurements, read the wind speed and direction (constantly in flux), then make the best shot they can.

biathlon shooter 2ndskiesforex

Trading is very similar.

And professional traders will never ask this question about ‘knowing‘. Why?

Because professional traders trade and think in probabilities. They know that certainty is an illusion. They know what you are really working with is ‘probability‘.

Hence the best you can do is align the probabilities in your favor as much as possible.

Are There Ways to Improve Your Ability To Read Key Levels?

Yes, I have an entire lesson dedicated to this in my price action course. We cover how to work with key levels across multiple time frames and context.

Do I Look for Confirmation Whether The Key Level Will Hold?

I’ve talked about this how hedge funds do not trade confirmation price action signals. They give you a worse entry and actually lower your overall profitability and accuracy.

Hence I do not look for confirmation signals at key levels. You can read more about why I don’t trade confirmation signals at key levels here.

In Conclusion

Until the Hal 9000 is available for trading, I’m not sure we will have an ‘objective’ way to trade key support and resistance levels.

hal 9000

It’s important to understand where this mindset comes from and why you should trade and think in probabilities.

It also helps to think of support and resistance as a zone of order flow, not pure lines in the sand.

Most often, traders who struggle with the probabilistic nature of trading are wanting certainty. But this is an illusion in trading. We have to get comfortable with certain parts of trading that will simply be ‘unknown‘.

Your ability to read key levels will improve over time, and there are many things you can do to improve your ability in this. We teach these methods in my advanced price action course and how to increase your skills trading key support and resistance levels.

Eventually you’ll develop the confidence to trade them without confirmation. And when you do, you’ll see your profits, accuracy and profitability increase tremendously.

Your Turn

Have you been wondering how you will ‘know’ if a key level will hold? Do you find yourself constantly looking for ‘certainty’ and ‘confirmation’ around a key level?

Make sure to comment below and share your thoughts.

One of the more crucial lessons in my price action course is called ‘The 10 Key Tips For Trading Support & Resistance Levels You Must Know‘.

In today’s article I’m going to share two forex support and resistance trading tips from the course lesson which can have a massive impact on your trading and understanding of price action.

The first one will focus on the price action context around key support and resistance levels between higher TFs (time frames) and intra-day TF’s.

For the record, I view the higher TFs as the daily and 4hr chart while the lower TFs to be between the 1hr and 5m charts.
The second key point around trading support and resistance covers the order flow and price action around high probability trades.

Intra-day Price Action Context Can/Often Will Contradict Higher Time Frame Context

Because of the higher time frame myth narrative (which states the only way to trade price action is via the higher TFs), those following this narrative have neglected a key part of price action.  That is learning to understand and read intra-day price action.
Because of this, traders have treated anything in the lower time frames as ‘noise‘ which is a false understanding of price action and time frames.

Lower time frames are just a different lens into price action and sometimes can offer a more nuanced understanding of the order flow behind the PA.

This has led to many traders not understanding that intra-day price action can and often will have it’s own context. This is a problem because we have to understand how the intra-day PA may affect or inform our trades for that day.

What it also translates into is intra-day price action context can and often will contradict the higher TF context.

Hence if we are trading with the intra-day context, but against the higher TF context, our holding times by default should be shorter and we should be anticipating (or be prepared) to exit quicker.

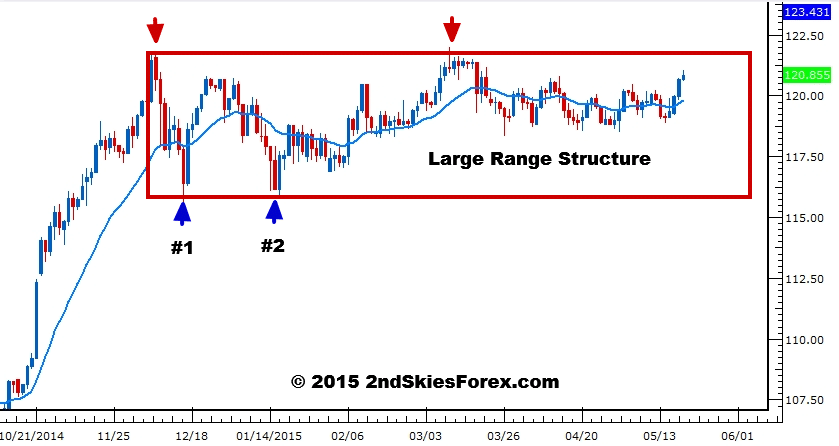
I’d like to share a good example of this principle with the USDJPY which has been in a large 550 pip range since the end of last year.

USDJPY Daily Chart
usdjpy daily chart

What you are seeing above is the USDJPY daily chart.

After a large bull run from 107.50, the pair entered a corrective phase forming a large range near the highs between 115.75 and 121.15.
You’ll see the range marked by the red box and the first two pullbacks into support (#’s 1 and 2) which were around Dec. 16th and Jan. 15th.

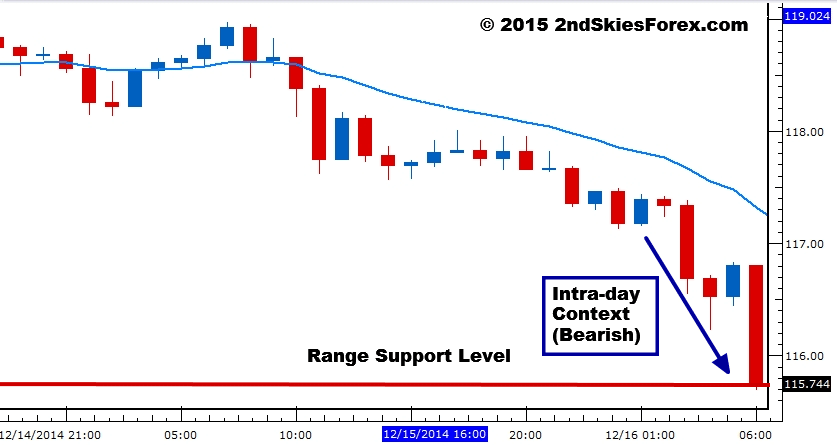
In the next chart, you’ll see the intra-day price action context on Dec. 16th via the 1hr chart.

USDJPY 1hr Chart
usdjpy 1hr chart

Notice how the intra-day price action context is completely different from the higher TF context?

By not segregating the two types of context (intra-day and higher) we can often get scared out of these trades as they run into our key levels impulsively.

Many times I hear struggling traders email me how they had a trade setup to buy or sell at a particular level and trade location.
Yet because they were watching the intra-day price action context only, they abandoned the trade.

However right after you let the trade go and canceled it for fear of getting stopped out, the market touches there entry location, bounces right off of it and runs straight to your target.

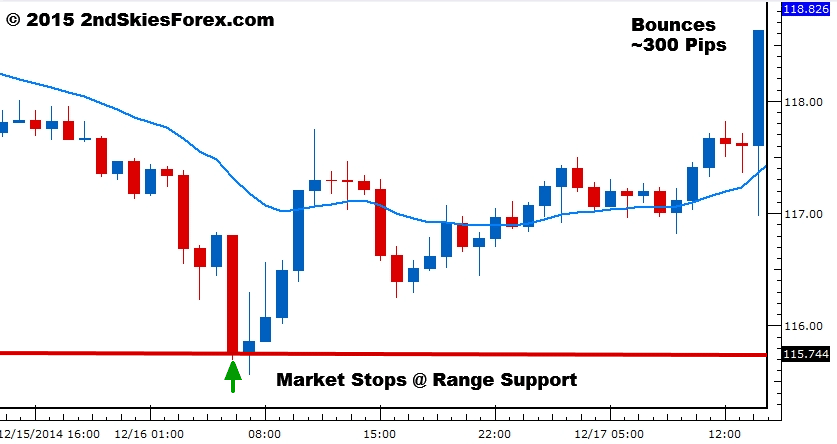
A great example of this is the USDJPY pair on Dec. 16th (see below)
usdjpy 300 pip bounce off key support

Hours later after not taking the trade, you are wondering why you abandoned your trade plan and missed out on a perfectly good trade.

Has this ever happened to you?

It’s certainly happened to me, and likely all of us at one point.

The key point here is it’s important to understand intra-day price action context can and will contradict the higher TF context.
This DOES NOT mean we abandon the lower TF context for the higher one. We have to understand it is information and can often add to our trade ideas.

But ignoring it and focusing on the higher TFs only is not the approach as this leaves you lacking a key skill – learning to understand and read intra-day price action.

And this skill will be of great value to you in locking in high +R trades when learning to manage them.

Impulsive Rejections & Short Holding Times At a Key Level are a Positive Confluence Factor

This one is important to understand regarding the order flow and PA around (and off) a key level.
Many times the PA will just consolidate around a level before making a move (to hold or break). There are plenty of price action clues we can learn to read which will intimate the more likely scenario.

But anytime you see a very large reaction off your trade location around a key support or resistance level, it usually indicates a positive confluence factor to your trade.

Why?

Because the sharp bounce more often is caused by large institutional players holding/defending a key level with strength.
Being able to reverse the move into a key level takes size and volume, and pushing back with vigor indicates the ability to absorb the pressuring heading into the level (often called ‘absorption’).

By creating a heavy imbalance between the buyers and sellers, this further reduces the counter-move interest and shows the order books are likely heavily stacked to one side which further supports your trade idea and location.
Also the fact the PA spent little time at a level indicates the speed of the buying interest from the institutional side which is also highly supportive for your trade.

The key take home point from this is to a) be able to observe and read the price action and reaction off the level to get an insight into the order flow around the level, and b) understand this impulsive bounce likely indicates a high profit potential trade.

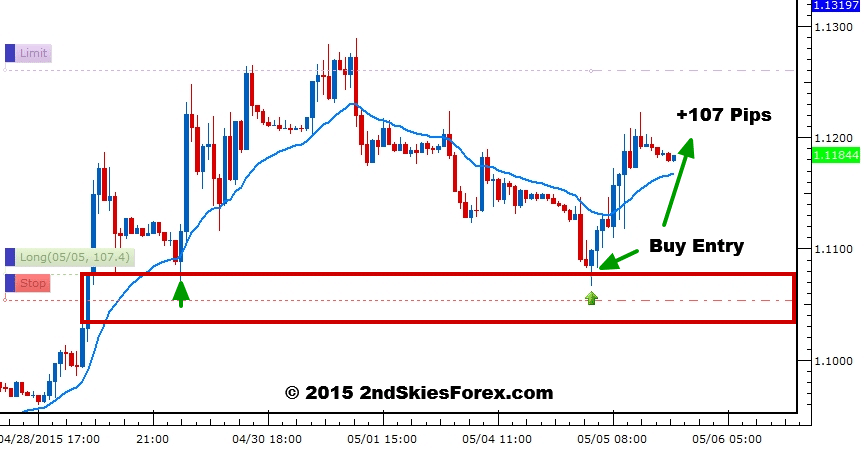
An example of this is in the chart below on a live trade setup for the EURUSD we profited from heavily and I traded with my own money (really can’t believe I have to keep saying this as I’m only always trading with my own money).

EURUSD Live Trade
live price action trade eurusd profits heavy

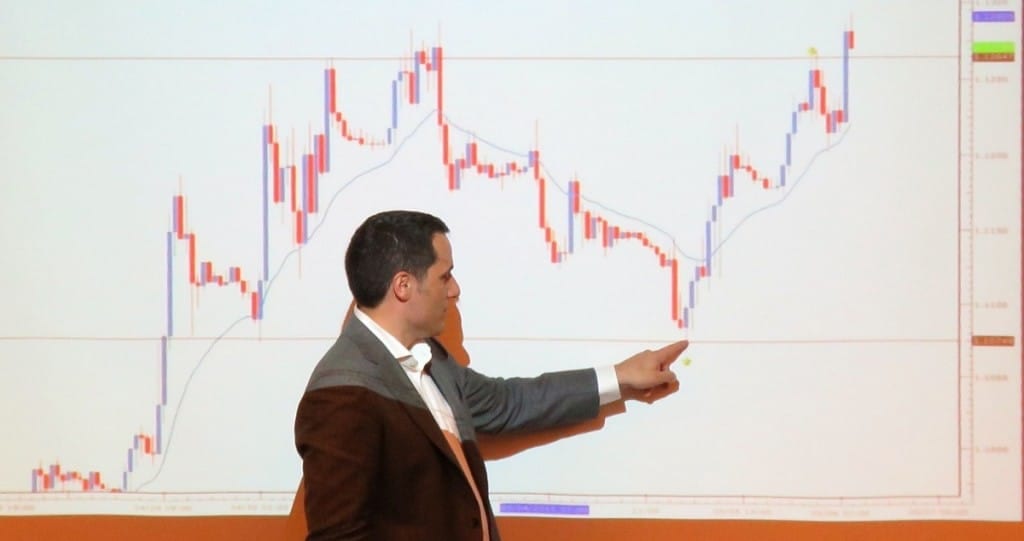
Looking at the chart above, you are seeing a screenshot of when I was in the trade, showing my entry trade location (1.1075), my SL at 1.1050 and my TP and 1.1250/60.

This trade ended up hitting it’s target, but notice how the pair bounced off the support level quickly forming a pin bar rejection in the process.

NOTE: If you were trading the illusory pin bar 50% retrace tweak entry, you would have gotten a much worse entry location vs. mine.
It is important to understand why confirmation in price action is an illusion and how it hurts your profits.

Regardless, the nice tail rejection + closing on the top of the bar indicates strong buying off my entry location.
The fact the next two bars also repeated the same meant a) my trade almost never went in the negative, and b) the strong impulsive reaction off the level indicates a high +R potential trade.

And that is exactly what happened profiting +186 pips on a roughly 25 pip stop for a +7.5R trade.
How often do you get those trading your daily pin bars?

In Review

Ignoring the intra-day price action context will leave you with a weakened skill level and ability to understand the overall price action context. Yes, intra-day context can and often will contradict the higher TF context, but this does not mean we ignore them.

It is simply ‘information‘ and can be highly informative for us when either trading intra-day, with trend, or counter-trend.
The information can also be informative to us about our trade when you learn to read the subtle price action clues before, and at the level.
Also we have to be aware of highly impulsive reactions off a key level as that could indicate a larger profit potential for our trade.

You may have a typical +2R profit target for your trade, but a highly impulsive and quick reaction (or short holding time) at your trade location may indicate there is a larger move in play (and thus more profit potential).

With that being said, what tips do you use to help trade price action around key support and resistance levels?

Please share, like and tweet these forex support and resistance trading tips along with sharing it on any forums or with anyone you think can benefit.

Having trouble building your skill set for finding key support & resistance levels? Then you’ll need to train in finding them. The key lies is first identifying the price action context. Once you have this is in place, then you know what levels to look for.
In the beginning, we talk about one type of trend (volatile trends), and how to identify them. Then we discuss using this type of trend to determine what levels to find. We end by showing  how you can use Forex Tester 2 to help build your skill set in finding key support & resistance levels.
For those wanting to get the $50 discount, you can get this and order by clicking on the link Forex Tester 2 $50 Discount

One of the more difficult aspects for traders is placing highly effective stops. Either most beginning traders place stops too tight or too far away.  Place stops too close to your entry and they are likely to get hit.  Too loose and they unbalance your risk/reward ratios.
In today’s article, I’m going to share 2 tips for placing highly effective stops and how these can help you increase your accuracy and profit potential.
1) The Reason You Entered the Market
You should always have a reason to enter the market.  Ideally it based on a price action pattern that has repeated itself in the past, and will likely do so again.  All patterns have variables that repeat themselves, and it is this ‘repeating‘ we want to happen again, thus allowing us to profit from a predictable event.
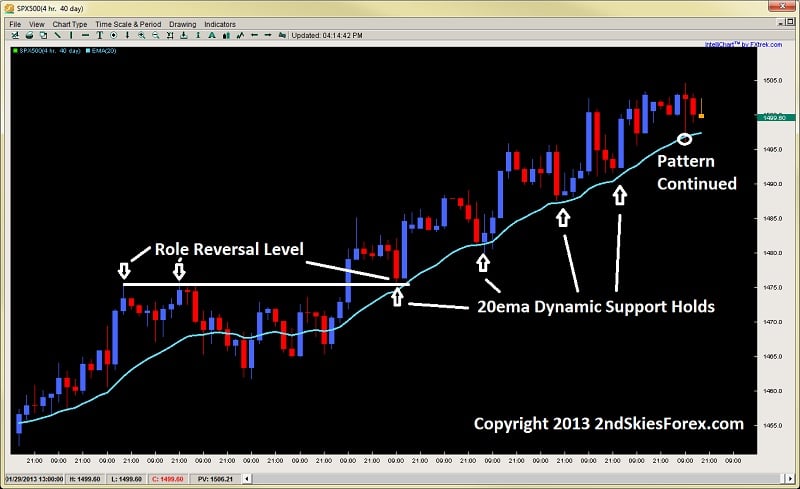
If the reason you bought a pair was because the dynamic support and 20ema was holding on the 4hr chart several times, then your reason to exit should be a violation of this.
I recently wrote in my market commentary how the S&P 500 bounced 4x off the 20ema.  If the reason for buying was the anticipation price would bounce off the 20ema again, then my reason for exiting would be the opposite of this happening. Today this is exactly how it played out, bouncing for a 5th time, and offering a trader to profit from it greatly (see chart below).
3 tips for highly effective stops dynamic support S&P 500 2ndskiestrading.com jan 28th
Now if the price action breaks and closes below the 20ema (something it has not done in 11 days), then the pattern has broken down, and it is no longer a tradable event.
But in terms of placing a stop with this trade setup, we could have looked for the largest breach below the 20ema over the last 11 days, and placed our stop just below this upon entry.  Had you done so, you could have easily grabbed a 3x reward play on the last 20ema touch.
2) Stops Are Best Placed Above/Below Support & Resistance Levels
Institutional traders place their orders around levels more than anything else.  When many orders from a lot of players with a lot of money, occur at a particular price, it often creates a strong reaction at a level. And when price ‘reacts‘ to this level more than once, it often becomes a key support or resistance level.
Thus, stops are best placed above or below key support and resistance levels. It is here that the larger players are placing their orders, and thus likely to defend your entry and stop.
If you do, then in following the logic of rule #1, we should be getting out of the trade if the level is clearly breached.
Lets take both sides of a potential trade below and see how we could have placed our stops effectively buying or selling.
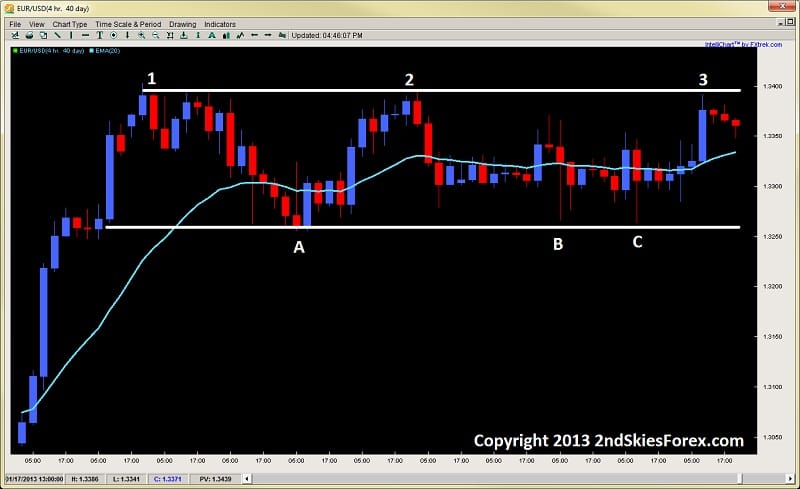
EURUSD 4HR Chart
placing effective stops using support and resistance levels 2ndskiestrading.com jan 28th
Starting with the left side of the chart above, we have a strong impulsive price action bull run, that finds sellers just below 1.3400 , or point 1. This selling pulls back to A where it finds support around 1.3250, and then re-attacks the sellers just below 1.3400 again at point 2.  Now if you were a seller, and had seen price hold just below 1.3400 2x, and sold at pt 2, the logical place would be to put it about 10 pips above the round number, while targeting the buyers around 1.3250.
Why 10 pips above 1.3400?
Because this is a round number, statistics show typical stops for selling orders placed at round numbers are often within the first 9 pips above (so 1.3400-1.3409).  Of course, always make sure price action confirms this, but this is a general rule you can use.
Now if you want to be a buyer in this case – taking a with trend continuation play, then buying at B or C, with a stop 10-15 pips below 1.3250 would have also worked out, targeting the resistance at 1.3400.
Now trades will not always be this clean in terms of support and resistance levels, which leaves you two options;
1) Only trade when the price action is really clean
or
2) Learn to place really efficient stops
I understand the latter may be more difficult to do, but you can find more high probability setups by adding a key component.
Impulsive Moves
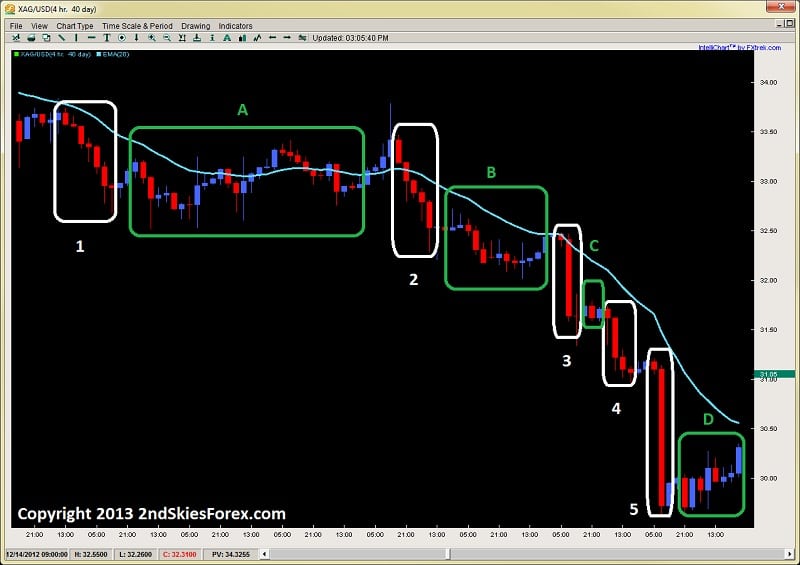
One way to increase your chance of having a profitable trade, and placing an efficient stop, is to trade with trend more than counter-trend.  When trading with trend, the majority of the order flow is already on your side, so look to consistently trade with impulsive price action moves, not corrective ones.  If you can do this, then you will build your confidence in placing efficient stops, because you are getting in with the larger players.
A great example of impulsive and corrective moves is in the chart below.
impulsive-price-action-2-tips-for-beginning-traders-2ndskiestrading.com jan 28th
You will clearly see how much more profitable one would be selling the impulsive moves (white boxes), and not the corrective moves (green ones).  When you can learn to spot and trade with these moves, you will find your stops tend to get hit less, and your full profit targets achieved.
One Final Note
It should always be noted, when a beginning trader looks at a trade, they see profit first, and risk second.  A professional on the other hand, looks at controlling risk first, then profit second.  So once you have a trade idea and potential entry, figure out your stop – which should be placed where the market should not go if you are correct.
From here, calculate your risk in pips, and then find a target which can be easily achieved with consistency. If the math works, then pull the trigger, and let the trade play out.
In Summary
Placing stops tends to be one of the more confusing things for beginning traders, as they are often placed too far or too close to your entry.  By learning to place stops close to key support and resistance levels, you will find they are more well defended than it no-mans land.
Also, by placing stops based on what the market should not do if you are correct, then you will find your stops get hit a lot less.
Lastly, when trading with impulsive moves, you increase the probability your trade will be profitable since you are trading with the flow of the larger players.
To learn rule based systems for placing effective stops, limits, entries and exits – make sure to check out my Price Action Course.
Kind Regards,
Chris Capre