Here is a video of a live price action trade setup on the Dow Jones showing my entry, SL and TP. This trade ended up profiting +7R after holding the entry level perfectly.
Watch the video for a detailed description of the price action context, along with my strategy for taking the trade, SL and TP placement.
Want to make trades like this? Click here to become a member of my Adv. Price Action Course.
Tag Archive for: price action context
A while back I heard a professional trader who ran a trading desk sum up ‘set and forget forex trading‘ strategies in one sentence:
“That is like getting in a car, putting your foot on the gas, and expecting to get from point A to point B without crashing – complete stupidity.”
By and large, I have to agree with him. There is a lot of confusion around set and forget trading, and it’s likely costing you money.
In today’s article, I’ll begin by sharing the fallacy in this way of thinking and how our brains are wired in relation to trading. Then I’ll cover the ONLY TWO SCENARIOS you should use a forex set and forget trading strategy.
From here, I’ll talk about evolving markets and how this relates to set and forget forex trading. After this, I’ll end with talking about how you limit your profits and how to avoid capping your growth as a trader.
The Irony & Fallacy of Set and Forget Forex Trading
The irony (and fallacy) hiding behind this one size fits all approach is it assumes you are responsible enough to make a good trade entry, stop loss and take profit, BUT you are clearly not mature, intelligent or responsible enough to manage a trade. How ridiculous.
To be fair, our brains are not wired for all the mechanics of trading, and our natural bias is negative towards most things, especially threats.
The translation of how this bias affects us is: we are more likely to close a trade when it goes against us (threat) vs. working for us (beneficial). And I’m sure you have experienced this yourself.
The Scenario
You are in a trade, everything is going for you, the price action is impulsive in your favor, you are in profit…and then…the first major candle goes against you. Immediately you think the move is over and you close the trade to lock in profit.
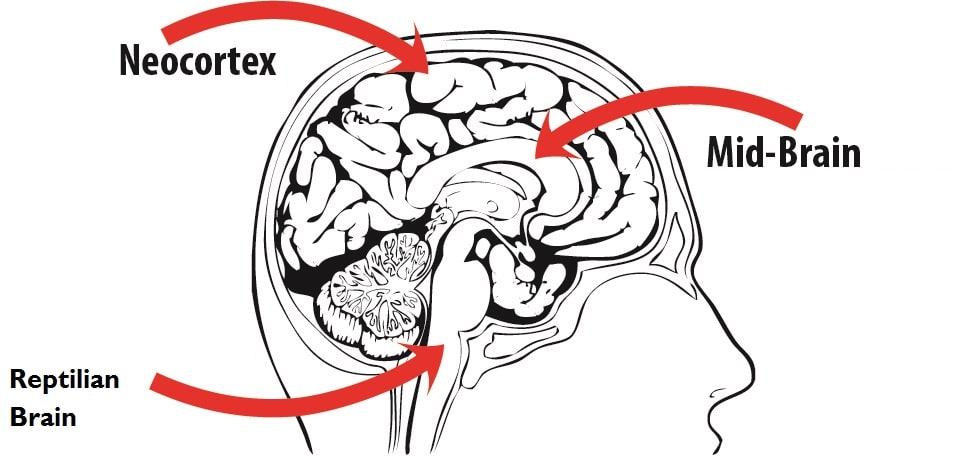
Has this happened to you? If so, its your brain and reptilian brain working against you.
(NOTE: For a great trading article on the negative bias in trading, read Why We Close Winning Trades Early)
Change & Growth Come Through Re-Wiring Your Brain
To be successful in trading (and anything), you have to re-wire your brain and change your habits. This is best done through repetition, focused awareness and skill based training.
We can either walk on eggshells around our negative biases (no growth), or we can learn to get past them (growth). Simply turning to a one size fits all approach for taking profit (or managing the trade) isn’t the answer. It leaves you crippled in terms of growth and assumes you’ll never get over it.
That is like saying you should never drink a beer (or glass of wine) because you’ll never be able to control yourself. Or you should never get a drivers license because you’ll never be responsible enough to drive on public roads. Ridiculous.
In reality, set and forget forex trading is simply ONE method for managing the trade. And it should (in reality) ONLY be used under two circumstances:
#1: You only have one, maybe two hours per day, and have no real way to manage your trades. Perhaps you work full time, have kids, and are just really really busy with a super tight schedule.
In this case, you are probably best employing a forex set and forget strategy as a profit taking method using daily and 4hr price action strategies, but there is a big assumption in this.
The Assumption
The scenario above assumes you are a) not trained in reading price action context, or b) your trade will likely hit its stop loss or take profit after you enter, but while you are busy.
Hence, unless you are not trained to read the price action context in real time, or the trade will close while you are at work, then you are a decent candidate for a set and forget forex trading strategy.
If your trade will take a few days, then this may not be the best method, because as it progresses, it may show signs it could go for a big runner. These are trades you have to take advantage of when they come, just like a really good poker player loads up on a strong hand.

Once you get good at reading the price action context in real time, you can also trail your stop and reduce your risk as the trade progresses. Almost every professional trader will reduce risk as their trades advance.
Very few will look at it as a hell or high-water scenario, which is what you are saying when you use a set and forget trading strategy as your method.
The other scenario is below.
#2: If after exhausting all other methods of managing your trades (taking profits and adjusting your stop), and the ONLY baseline method which showed profitability, then you’d be a decent candidate for the set and forget method.
This one is pretty straight forward, and the risk of ruin needs to support your decision. Without it, you could have the numbers working entirely against you without even knowing it.
Thus, if you are that trader who falls outside of the two above reasons, you should explore other options, and develop an accurate baseline for gauging which method you use.
Markets Evolve Over Time
The bottom line is the market evolves as it progresses over time. This can happen intra-day, daily, or over days and weeks. Those that train and learn to adapt with such changes in real time will have their finger on the pulse and maximize opportunities.
This is what institutional traders do. They adjust and evolve their positions as the market does, just like a poker player will become more aggressive (or conservative), based on the players around him, and the size of his chips.
Just realize if you don’t explore other options for managing your trades, and train to get beyond your weaknesses, your growth will be limited, and your profits will reflect this.
Having A Curfew on Profits
But perhaps that doesn’t sway you. No problem, just imagine the following scenario:
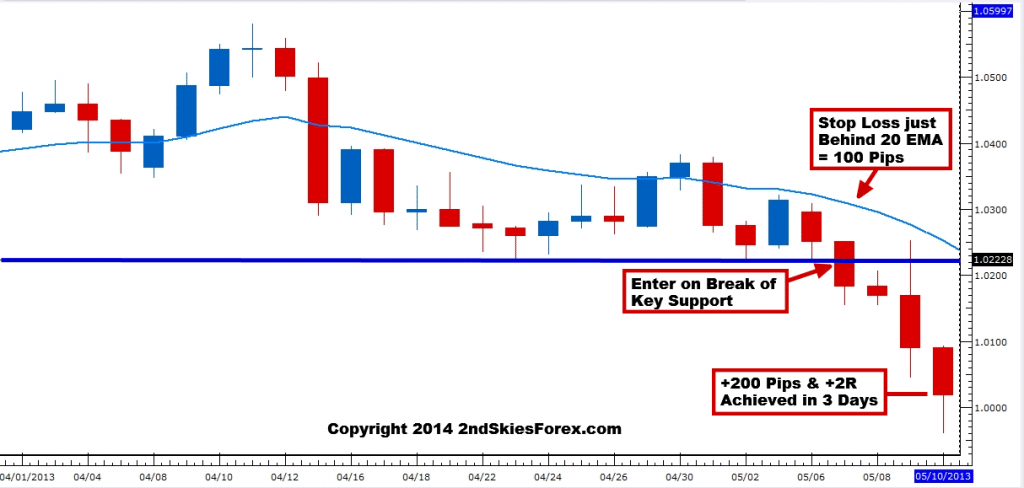
It is the first week in May, 2013. You have just entered short on the AUDUSD on a break below the key support level around 1.0225. Your stop loss is just above the daily 20 EMA, so -100 pips, and your ‘set and forget‘ target is +200 pips, or +2R.
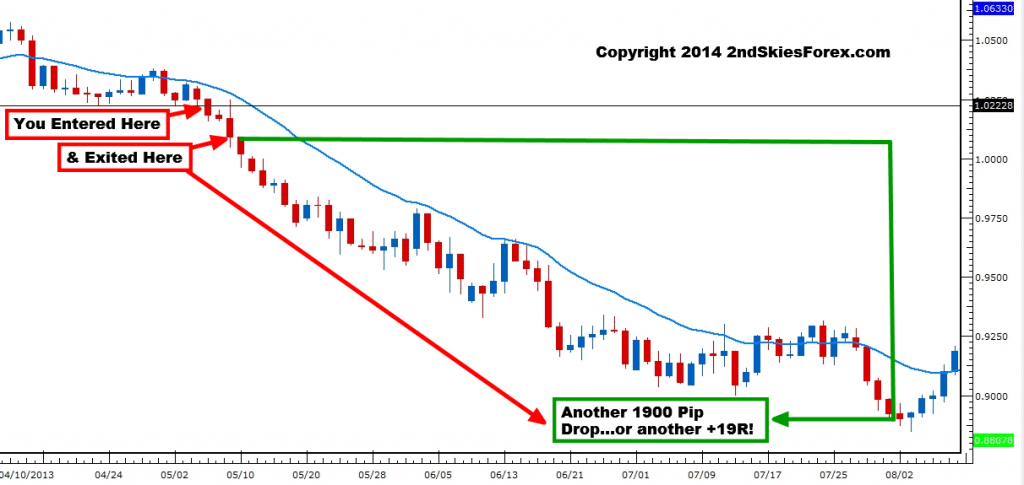
About a day later, it comes out on the news that George Soros has sold over $1 billion of the AUD. Considering Soros’s history, and that he doesn’t just get in and out in a day (along with the glaring fact other professional traders will likely pile on this trade), chances are this trade is going to run.
Yet…here you are, just a couple days later, saying ‘nope, I only set and forget because I ignore everything and cannot manage my trades responsibly, so I have this curfew on profits‘.
About a day later, you hit your +2R profit, thinking you are a darn good trader. This is your chart below.
Looks great eh?
Keep in mind, this situation above happens on a micro-scale almost every day, sometimes many times per week.
So when you consider employing a forex set and forget trading strategy, realize there are other options, and this should only be used in very specific circumstances.
Also understand, if you choose to use this method while you have other options, you are a) putting a cap on your upside profits, and more importantly b) putting a limit on your growth and development as a trader.
There are many other methods for managing your trades regardless of what time frame you trade. For those wanting to learn more about these methods and how to leverage them in your trading, learn about my Trading Masterclass Course where you get access to our daily trade setups commentary, trader quizzes, private member webinars, live trade setups forum, and more.

There is a statement non-profitable traders often use regarding some of their losses. Perhaps you have heard this before, or said this yourself (myself included years ago).
It is the commonly used term ‘Failed Trades‘, which is something of a misnomer. In reality, there are no ‘Failed Trades‘. In fact, there are only three types of outcomes from any single trade, and they are not the win/break-even/loss you are thinking of.
These three types of outcomes from any single trade are; winning, learning, and failing to learn from. The idea of a ‘failed trade‘ is the latter – that being one you failed to learn from.
However the very mention of the term ‘failed trades‘ brings up something crucial about our trading mindset. That is – we cannot define ourselves by our last few trades, whether they made money or not. Think about it like this;
What if you are 50% accurate, and generally scoop up 1.25R per winner? According to the risk of ruin, that level of accuracy, risking 1% per trade (and R won per trade) will mathematically make you money.
Another perspective around this would be to examine coin flips. How so?

You can flip a coin 10,000x and end up with 50% heads and tails. Yet…inside that 10,000 rounds of flipping, you may have 7 heads in a row. Now what if during those 7 heads you were betting tails each time? Would you call that a failure to bet wrong 7x? Probably not, yet its perfectly natural to have moments of random distribution like that, even in a coin flip.
Translation: you will have losing streaks which will be part of trading. You will also have ‘hot streaks‘ which are part of the same process. These winning and losing streaks come via any natural distribution curve. Individually, they’ll look like streaks, but in reality, this is an illusion, because they are statistically going to happen. Which is why we have to focus on something else.
A Students Trading Process: From 8%-38%
I recently had a student (we’ll call him Michael) who wanted to trade an anti-podean currency (Kiwi vs. the USD) as it worked for his availability. When he first started training with the pair on Forex Tester 2, doing live forward simulation training, his accuracy was a whopping 8%. Yep, you read that right, he was only accurate 8 out of 100 trades.
A month later, Michael was now 28% accurate. I just received an email from him showing me his myfxbook stats. Where is Michael at now? Currently clocking in at 38% percent. Maybe I should call him the crazy eights trader!
(NOTE: To get a $50 discount on Forex Tester 2, click here)
Now when you look at his trading over time, what you can see is the evolution of his trading via focusing on the process (not results). He is evolving over time and continually getting better. If you define yourself by your last two to three trades, you are focusing on a see-saw, which, technically could oscillate with a loss following every win forever!
By focusing on process, and your trend in terms of your overall trading process, you get a better handle on what you actually are – which is on a sliding scale. In other words – a moving target!
Michael kept his eye on the ball, and because of that, his process and performance is getting better. He’s constantly improving his execution, timing, and his read on the price action context. By getting better at reading the price action in real time, he’s noticing a steady uptick in his accuracy. His last two trades will never represent all the effort he’s gone through thus far, and more importantly – where he is going.
But He’s Losing Money…
Now you may think, ‘big deal, he’s still only 38% accurate, which is losing money.‘ Call it a guess, but I’m willing to bet at least 60+% of you thought 38% accuracy is poor in terms of trading, and that Michael was losing money. That would be true if his average R was +1 per trade. But he is generating over +2.5R per trade, which means Michael is making money consistently.
And now that he’s making money, is he just sitting there content with what he’s got? No – like a track runner constantly working to reduce his time, he is constantly refining his edge wherever he can find it. He is using the Aggregation of Marginal Gains, where every 1% edge adds up to a large result.
In Closing
We can now see there are no failed trades – there are only trades we fail to learn from. By focusing on process, and not the see-saw of the last 2 or 3 trade outcomes, we keep our eye on the target
We can now understand how hot and cold streaks are a common part of our trade distributions, so getting bent out of shape by a few losing trades means nothing. What is more important is having a successful trading mindset, which is focused on constantly improving and building our skill set.
When we do this, we will find ourselves making better decisions, worrying less about the outcome of each trade, and making more profitable trading decisions.
Key Talking Points:
- False Breaks Offer Great Price Action Trading Setups
- You Can Trade the False Break Strategy with Pin Bars and Engulfing Bars
- Look for False Break Setups Trading With the Trend
Ever tried to enter on a forex false breakout breakout setup, only to have the trade immediately reverse on you? I’m guessing this has happened to you many times (present trader included).
With the market volatility declining over the last several years, false breaks can and will happen all the time. The key to avoid getting stopped out, and actually profit from these false break setups, is to understand the price action context which often precedes them.
In this two part article series, I will begin today’s discussion by defining a false break. Next, I’ll go over a common false break setup, which is trading the false break with trend. Then I will go over a fundamental false breakout strategy, and conclude by recapping the key points.
What is A False Break?
I would prefer to define a false break as one of the following two scenarios:
- A break above/below a prior candle that fails to close above/below that candle
- A break above/below a key level, quickly reversing that level, and sparking a counter-trend move
Below is an example of the first type with a pin bar + false break:
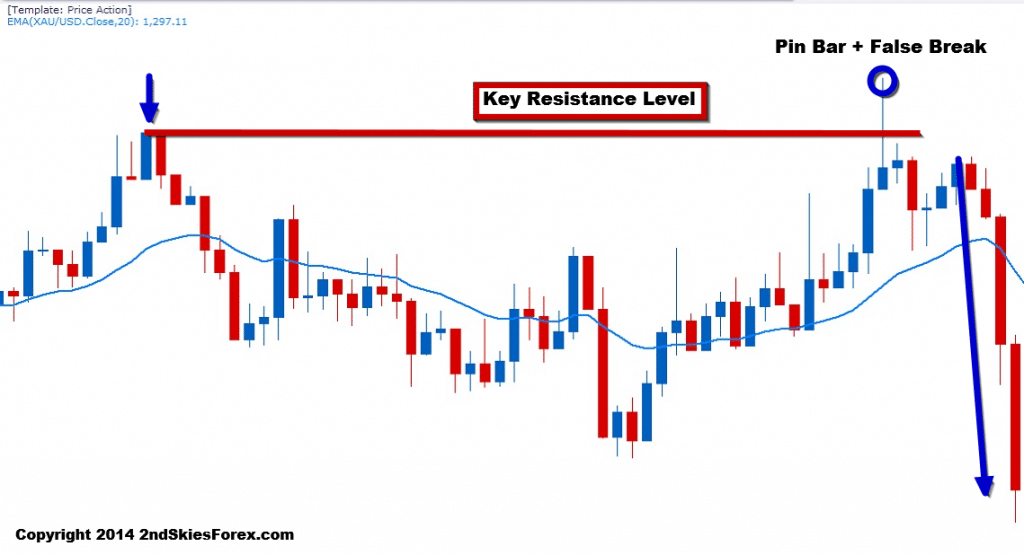
In the chart above, you can see the arrow to the top left, showing a bullish move running into resistance. The pair then settles back, and makes a second attempt to take out this key level.
But on the top right, you can see it forms a pin bar + false break.
From an Order Flow Perspective
Looking at this from an order flow perspective, the bulls were in control leading up to the level, and were able to push past it. Either there was massive profit taking on their part, or they ran into heavy sellers a few layers deep behind the level.
Regardless, the sellers over-whelmed the buyers, and pushed the pair back below the key resistance level. After a second attempt to regain the level, the sellers realizing they had control, sold even more, pushing the pair down impulsively.
Trapping Traders
In most false breaks, there are ‘trapped traders‘, meaning traders who are caught long when the pair is about to go short, or vice versa. Those trapped traders once the trade goes negative, will likely be stopped out, & further fuel the counter-trend move.
The more savvy traders will exit manually when they realize they are trapped, while the slower traders will likely get hit for the full stop. There are price action clues to tell when you’ve been trapped, but that is for another article.
Trading The False Break Setup With Trend
It should not be surprising, one of the best false break setups occur when trading with the trend. This is because the underlying order flow is heavily imbalanced, meaning it’s heavily bullish or bearish.
When a false break setup forms counter-trend, it usually runs into buyers or sellers who are happy to take the pullback getting a better price. Their overall strength in the market makes it harder for counter-trend false breaks to be maintained.
This is why false breaks present such great trade opportunities.
Below is a classic example of trading the false break setup with trend:
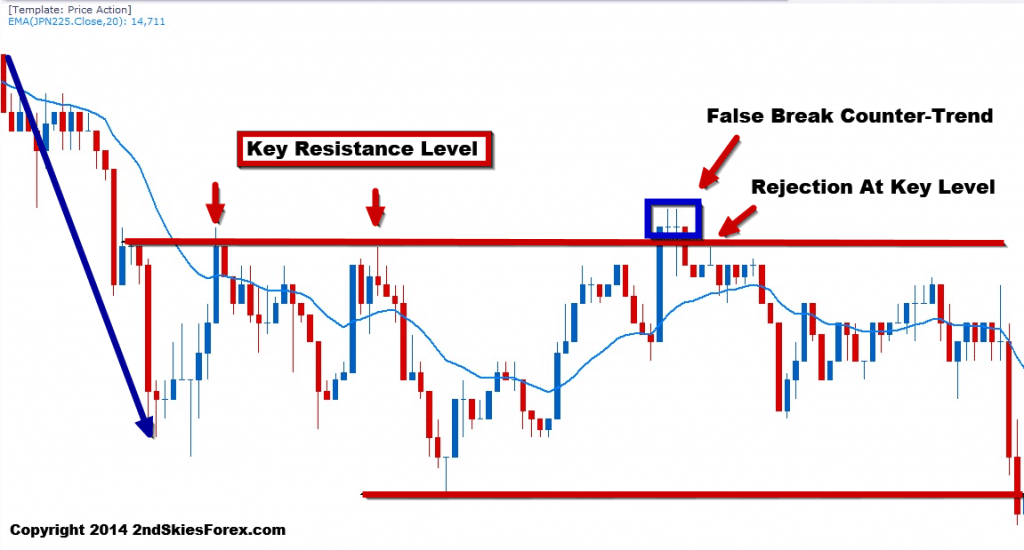
In the chart above, starting with the top left, we can see the heavy impulsive selling. Eventually this leads to a bounce which hits the key resistance level 2x (marked by two red arrows). After forming a new low (red line at bottom), the pair bounces to retest the bears at the same resistance level.
Now note how the pair breaks above this level with a really large blue bar, closing at the highs. Ask yourself, if the bulls were really in control, how come they did not produce any follow through?
The next two doji candles showed no real strength or follow up buying, which should have been a warning sign to any bulls already long. Bears wanting to trade with trend, should have been looking for the false break and close below which they got on the 3rd candle.
Entry, Stop & Take Profit
With such a clearly defined trend and resistance level, there are two general entry techniques;
- Sell on Break back below the key level
- Wait for pullback setup to the key level
More aggressive traders who feel confident in their price action skills may sell on the break back below the key level. This may or may not offer the best price, but you may not get a second chance to enter if the sellers came in hard on the false break.
More conservative traders can wait for a pullback setup to the key level. If the false break is real along with the level, then the trade should hold and not go much into the negative.
I generally recommend placing the stop above the high (or below the low) of the false break by a few pips, depending upon the volatility and liquidity of the instrument.
The first target should be the other end of the consolidation. If you want to go for multiple targets, then the next key support or resistance level would be suggested.
To Recap
In today’s forex false breakout article, I talked about the price action and order flow behind a false break setup, and why it can be a powerful trade opportunity. I discussed the two types of false breaks and how to generally define one.
Lastly, I covered why to look for with trend setups trading the false break, giving the entry, stop and take profit methods.
When you learn to read price action in real time, you will begin to spot these false break setups more easily. As you get skilled in identifying them, you will avoid the common traps, and profit heavily from them as they offer great opportunities.
In the second part of this article, I will talk about using a false breakout strategy with pin bars and engulfing bars.
Having trouble building your skill set for finding key support & resistance levels? Then you’ll need to train in finding them. The key lies is first identifying the price action context. Once you have this is in place, then you know what levels to look for.
In the beginning, we talk about one type of trend (volatile trends), and how to identify them. Then we discuss using this type of trend to determine what levels to find. We end by showing how you can use Forex Tester 2 to help build your skill set in finding key support & resistance levels.
For those wanting to get the $50 discount, you can get this and order by clicking on the link Forex Tester 2 $50 Discount
I recently got a daily forex trading plan from a new student and eager beaver who asked for some help with their plan. The moment I opened it, I realized it was incomplete and needed work. To be fair, they had gotten this template from another course, so cannot fault the student.
I generally suggest having two trading plans:
- The Day-to-Day Trading Plan which includes your daily procedures
- Your Business Trading Plan
What we’ll be focusing on here is related to #1 above. Below is the general outline of their current forex trade plan, which I’ll go over, show you what needs to be changed, and what is missing.
Their Current Trading Plan
- Introduction
- Price Action Signals to Trade
- Rating a Trade
- Time Frames
- Pairs/Instruments to Trade
- Risk-Reward Ratio
- # of Positions
- Position Sizing
- Stop Loss & Take Profit Rules
- Rules for Entry
- News Events
- Documentation
- Losing Trades
Do you see anything confusing, missing, or out of place here?

What I Would Change
#1: Introduction – I think this was a good start. However, two things in this introduction stood out;
a) the opening statement, ‘The goal of this plan is to avoid emotion-based trading‘
b) ‘the trading plan may be adjusted, and the rules edited‘
Lets start with A – If the goal of the trading plan is to ‘avoid emotion based trading‘, the current plan only helps for that day, but doesn’t get at the root cause of ‘emotion based trading‘.
Where should the real work be done for this? Prior to any trading, and in the ‘training’ phase! How? Proper training, building your sub-conscious skill set, and removing limiting beliefs.
For B – this is fine to allow the trading plan to be adjusted, but how often? The trading plan should be an evolving document as your level develops and grows as a trader. But put a time factor to this and stick with it.
I would have in the introduction why I am trading, what I am trying to achieve and what my daily goals are. More on this later.
#2: Price Action Signals to Trade – A military general doesn’t start their plan with tactics. They take all the information in to get a broad picture – i.e. the ‘context‘. In trading, this relates to understanding the price action context first. So this section needs to be later in the plan.
What would I put here? Pre-trading preparation, i.e. how will you prepare for each trading day (physically, mentally, market analysis, etc).
#3: Rating a Trade – We haven’t even gotten to our price action context first. This comes before rating a trade for quality. So this should be done here, starting with our top down analysis, how we find the correct context, then go from here.
NOTE: In this template from the other course, their highest point rating for a trade was ‘big size‘ for the signal bar.
Now let me get this straight – the size of the 1-2 bar pattern, is given the most importance? One bar out of the 30-50+ bars which comprise the validity of the signal?

Seems like a confusion to me on what price action is about. Yet ‘Trading with the Trend’ is 5th on their list? How does one bar by itself, have greater value than the entire trend and order flow to this point?
Lastly, the 13-pt rating list completely rules out intra-day trading. A trading plan should be flexible enough to incorporate both.
# 4 & 5: Time Frames – by now, we are too far ahead of ourselves with this plan. Once we know the context, only then can we know the tactics (price action strategies) to use. We cover this in more detail with our course members.
One other thing about this is the fallacy that the time frame is more important than the instrument you trade. Should be the other way around.
Pairs/Instruments to Trade – Although this is completely necessary, I think in one section you can have the pairs/time frames you are trading.
# 6, 7 & 8: Risk-Reward Ratio/# of Positions/Position Sizing – The first one is completely irrelevant by itself without understanding the Risk of Ruin.
You can use my risk of ruin calculator to find yours. For more information on the risk of ruin formula, click on the link above.
Number of Positions – kind of irrelevant. Although you may have a fixed % equity risk per trade, what if you start your day, and realize 4-5 high quality setups on deck?
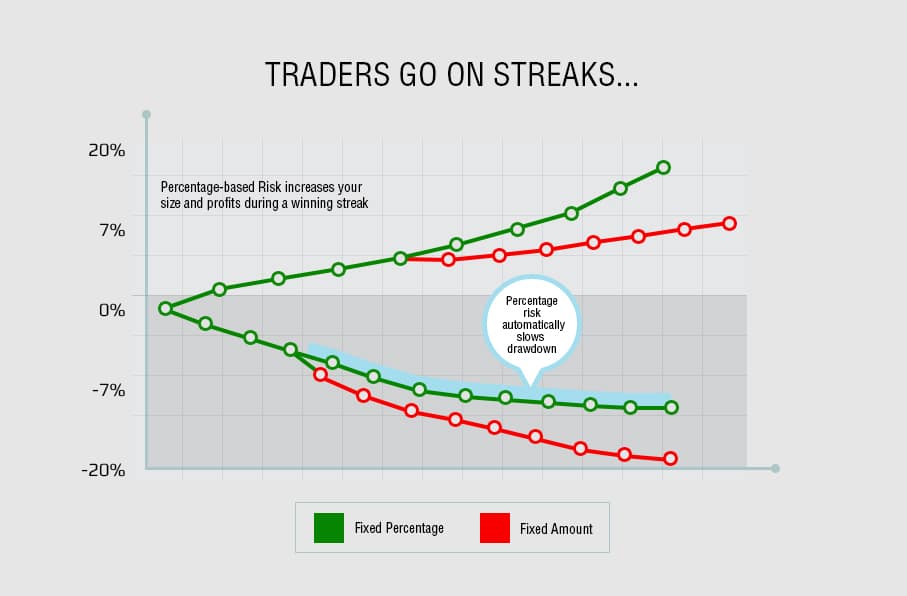
My suggestion is to have a max risk per day, and per trade. If your max risk per day is say 5%, and you spot 5 trade setups, then you can risk 1% per trade. If only 2, then you can risk 2.5% per trade. As long as you keep the risk of ruin at zero, the number of positions should not be limited IMO.
Position Sizing – Can all be addressed under one section, which I’d label ‘Risk Management‘
# 9 & 10 & 13: SL & TP Rules/Rules for Entry – should be addressed in the strategy itself.
#11: News Events – I’d say make this part of the ‘pre-trading preparation‘, under the ‘market analysis‘ preparation.
#12: Documentation/Journal – I agree this needs to be part of your forex trade plan. But there is nothing in here about reviewing your trades, or end of the trading week analysis. Monthly, quarterly and yearly reviews would be recommended.
What About Training?
I generally recommend having a completely separate plan for training, very much like professional athletes have practice/training routines, which are separate from game-day preparation. Trading should be no different.
For those trading higher time frames like daily and 4hr strategies, I’d recommend using your non-trading time for practice/training. This is not just demo trading, reading books, or studying course material. We suggest going beyond this with live forward simulation trading, just like fighter pilots do simulators, or baseball players have batting practice.

Our favorite tool for this is Forex Tester 2, which allows you to go back in time, and then live forward trade it bar by bar as if they were appearing in real time.
You can get a $50 discount on Forex Tester 2 by clicking here.
In Summary
As you can see, the template they were working with was quite confusing, lacking key things, and out of order. Had I been working off that trading plan and not known better, I would be approaching the market incorrectly every day, missing a dearth of things.
It is important to understand a professional trader will see things on a more sophisticated level than your traditional 1-2 bar pattern trader. Professionals, by default, can recognize opportunities beginning traders will not, like a good poker player can make money on more hands than a weaker one. This also goes for one’s daily forex trading plan, so having a more evolved one will give you a greater edge.

Ask yourself, how sophisticated is your trading plan? Does it feel unorganized, confusing and incomplete like the first template? Does it even include pre-trading preparation? What would you recommend adding to this trading plan?
Please make sure to share your answers, along with whether you agree or not, and why you agree/disagree.
Recently I got a question from a newer student asking the following;
“Right now I’m short this pair. It’s in profit, but it just formed a pin bar against my trade before I hit my profit target. What should I do?”
This is a common question I get about what to do when you see a price action signal that is counter to your trade. The question by itself actually tells me a lot about the student and where they are at in their process (beginning, middle or more advanced).
My response was similar to the following;
“It is important to understand we are not pattern traders. We are price action traders. Being a pattern trader, as in trading pin bars, inside bars, engulfing bars, or fakey’s does not make us a price action trader.
Pin bars are not the death of trends. I can come up with about 50,000 examples of trends both intraday, or on the 4hr and daily time frames whereby the trends ran into a pin bar at a key level, then smashed right through it. I can also come up with thousands where they did the same and reversed.
‘Wait, but those were counter-trend pin bars, what about with trend pin bars?’
Same thing, I can come up with 50,000 of those that were with trend, and the market reversed the prevailing trend. I can also find you thousands that were with trend and worked out.
So what was the difference between the ones that did work out and ones that didn’t?
The key was the price action context around the pin bar. How the price action was leading up to the pin bar, and around it (the context of how the pin bar formed) is what will make that signals useful or not.”
This is why it is such a freshman idea and a complete fallacy to think all you need to trade successfully is 3 simple patterns (pin bars, engulfing bars, inside bars). All that + trading with trend at key levels and VOILA! You have your A+ setup and a profitable price action trade.
If it were only that simple (FYI – if it were, a lot more people would be profitable).
So how do you deal with a counter trend signal to your trade?
The answer is in reading the price action context around it. I will share four charts below to demonstrate the point clearly.
Exhibit A
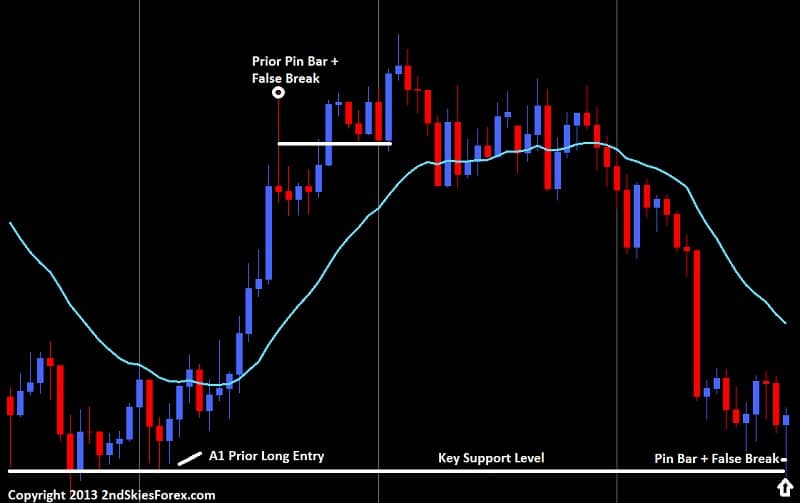
Looking at the chart below, we can see towards the left a double touch off the level R1, then a break through it with a large breakout bar. The market falls heavily and you look to get long around A1 on the bottom right of the chart. Your trade is working out great, but you run into a pin bar + false break (A1) at the key resistance level R1.
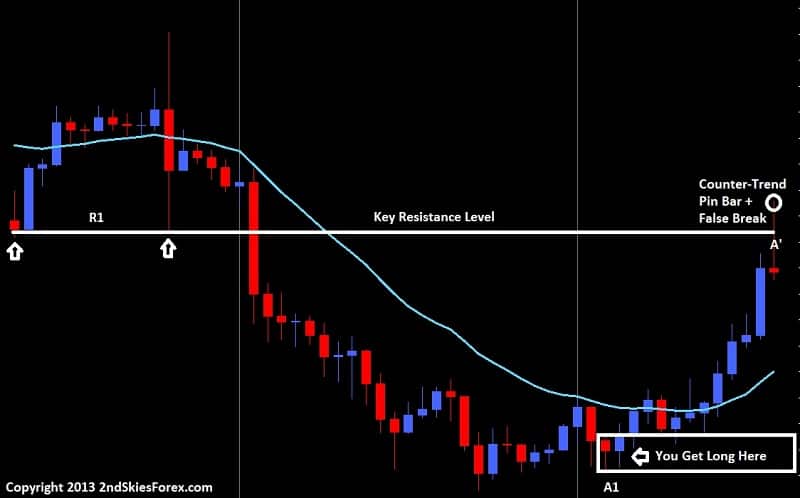
Minions of the 50% retrace entry on the pin bar are salivating because they think this is a great chance to short as you have a pin bar + false break at a key level, and the 50% retrace is at the level.
Meanwhile, you being long back at A1 see this pin bar and are worried about the market reversing thinking the move is over, so you exit.
Turns out both of you were wrong (see chart below)
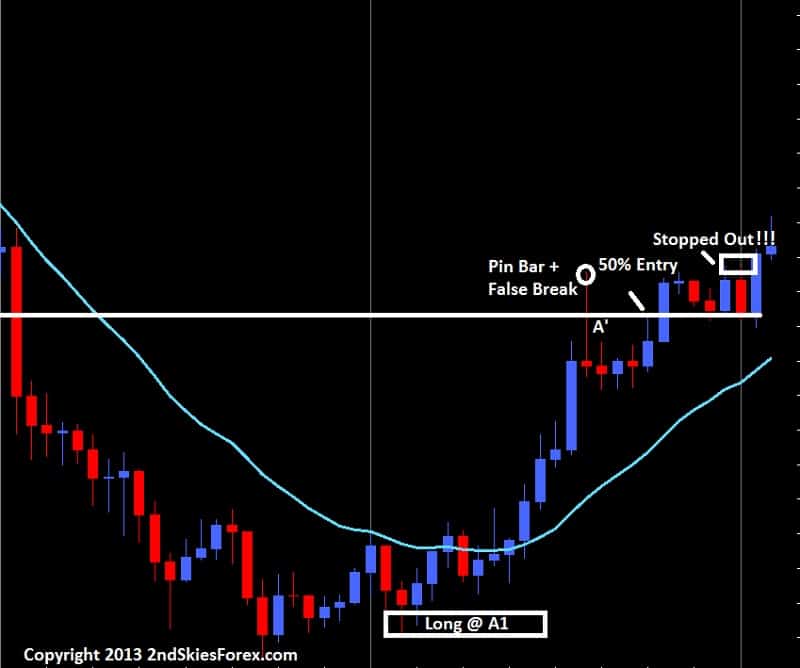
Exhibit B (later on in the same chart)
In this next chart below which is only a couple days later on the same pair, price eventually falls back to the same key level where we bought at A1 prior. It forms a consolidation just above it, then a pin bar + false break.
Great! Time to get in on the 50% retrace entry yes as its at a key level. Or, the other option touted is to get long on a break of the pin bar high yes? Either way, this is an A+ setup right since the pair is in a range and formed a pin bar at a key level right?
See the next chart below
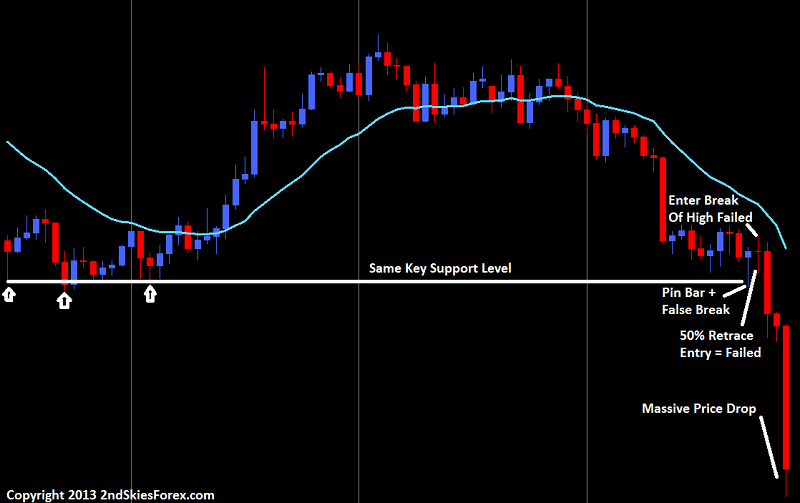
Turns out both pin bar entries failed, even though it was at a key level while price action was in a range. Now imagine you were long around the top of this chart, and ran into this counter-trend pin bar signal at a key level. You probably would have taken profit.
But by not understanding the price action context around the level, you would have missed out on a ton of profit, almost double your profit leading up to that pin bar.
This is why its important to graduate beyond the freshman concepts of trading pin bars, inside bars, engulfing bars, fakey’s, or whatever price action patterns. If trading were that easy, as in trading with the trend + key levels + price action signal = profitable trading, then a lot more people would be making money.
The difference between knowing when to take those signals is in learning to read the context and order flow behind the price action. Pin bars are not the death of trends. Nor are the other patterns. In isolation, or even with trend analysis + key level analysis does not make it a good trade.
Thus my answer to this students question about what to do when you see a counter trend price action signal to your trade – my response is to understand the order flow and price action context around that signal. When you begin to do this, your trading will start to turn. You will find yourself winning more trades, and holding onto trades longer. And while others are buying this last pin bar – you are selling it, and you’ll understand why.
Today’s article is going to discuss and dispel the 50% retracement entry myth on the pin bar strategy. The goal today is to talk about why this entry by itself is a complete misunderstanding of price action, order flow, and the pattern itself.
During this article, I will share two key points on why this is a sophomore entry on this commonly used pattern, how you can find a more optimum entry, and what you should be looking for.
Key Pin Bar Point #1
By itself – the 50% retracement entry is a completely arbitrary method. For those of you unfamiliar with this pin bar forex trading strategy, the idea is to take a fib-retracement of the pinbar itself, and enter on a 50% pullback into it.
Pin bars do not have some magical retracement level institutions and bank traders are looking at for getting into the pattern. The real power of the pattern is in both the trap and rejection of the price action.
Looking at the chart below on the 4hr Gold chart, we can the pin bar at the top of the chart marked A, and how its body and tail stick out of the prior bars (A’) high & close. When the price breaks the high of the first bar (A’), this brings in new intra-day breakout trend traders to get long.
Now the tail and wick of the pin is formed by sellers rejecting the bulls advance, and reversing their gains intra-day.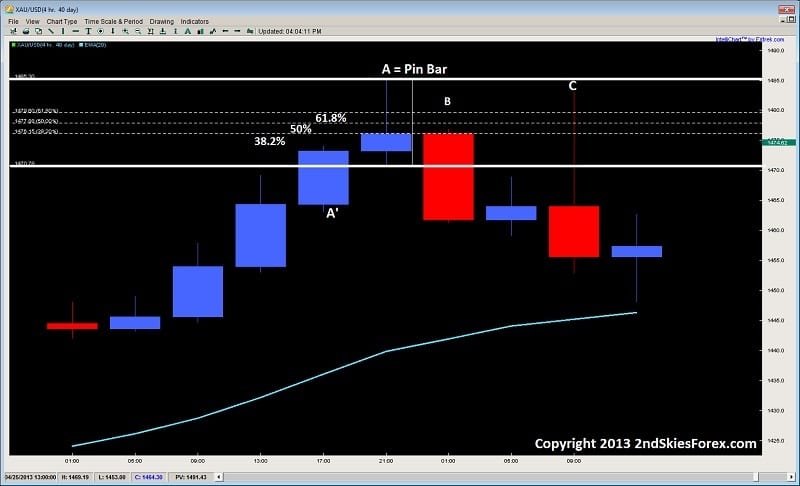
Once the market breaks below the highs of A’, this “traps” and stops out those bulls who got long on a breakout of A’. This trap forces them to cover their longs with shorts, thus fueling the sell side even further. But a few details have to be pulled out of this chart first.
- The highs of A’ are at the open of the next candle
- The close of the pin bar A is parked on a 38.2% fib retracement
- Neither of the above line up with a 50% retracement, so taking a long at the 50% retracement is completely arbitrary, and ignores the most recent price action
Now in relation to the first bar after the pin (B), we can see it never makes it to the 50% retracement, and stops right on the 38.2% level which was the most logical conclusion, as that is where the more active order flow was.
Taking a more detailed look with the 1hr chart below, we are looking at the same intra-day price action from the chart above, but with a little more detail using the 1hr chart.
Now the numbers 1-4, represent the 4hrs in the pin bar from the first chart. Even looking at this chart, do you see where the more dominant price action formed? You should be seeing it at the 38.2% fib retracement.
We can easily see this as the high of 1, the open and close of 2 and 3, the entire body of 4, along with the highs of 5, 6 and 7.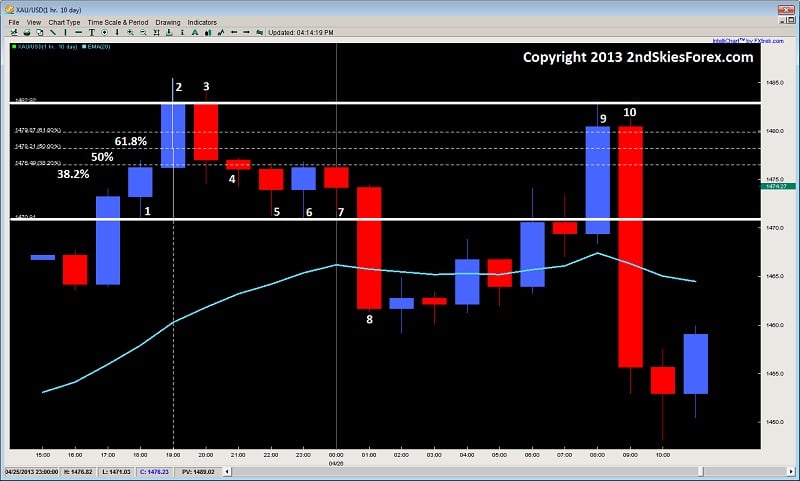
So as you can see, the 50% level has no meaning here, and is thus irrelevant as it ignores the most recent (and thus most important) price action.
Even the bars 9 and 10, blow right past the 50% retracement without even looking, and touch the close/open of bars 2 and 3.
This illustrates why the 50% retracement entry is a complete myth, and a sophomore understanding of both the pin bar, and how price action works. Thus, basing your entry on such an arbitrary play makes no sense and at all, and completely ignores what price action is about.
Key Pin Bar Point #2
If it’s not obvious by now, what you should be doing is basing your pin bar entry on the most recent price action around the pin bar.
This would mean using the prior bar at a minimum, along with the pins high, low, open and close.
The most ideal entry is not some arbitrary 50% retracement, but the actual high/low of the pin bar, or where the nearest key level comes in at.
Before all this, you need to understand price action context first.
Are we in a trend, or in a range? The difference between the two can have a significant impact on your entry.
From here, after you have assessed all this, you can see get a good gauge of where to place your entry.
Using another example from a proponent of the 50% retracement entry, the EURUSD recently formed a pin bar on the daily chart. The suggestion was to get short on a 50% retracement. Below is the daily chart of the EURUSD, and the projected entry.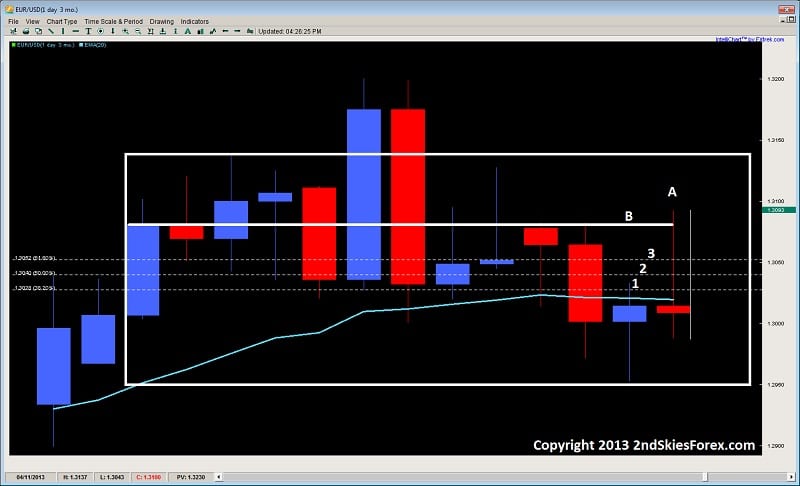
Now first thing we have to do is ask ourselves what kind of price action environment are we in?
Are we in a trend or a range? It should be obvious we are in a range. Thus the golden rules apply, that when in a trend, trade it like a trend, and when in a range, trade it like a range.
Now using this chart above, we can see the range outlined by the box.
The pin bar is marked A, and the fib levels are 1, 2 and 3, for 38.2, 50, and 61.8% retracement levels. Now, although there is some decent price action around both the 38.2%, and the 50% retracement levels, the bottom line is we are in a range – so selling at the arbitrary 50% level is selling in the middle of a range!
Do you really want to sell in the middle of a range? I didn’t think so.
If you really look at this chart, you will notice a ton of rejections around the key resistance level line at B, so your minimal entry should be to get short at B. But, since its a range, we don’t want to consider getting short till the upper regions of the range.
This would mean the pin bar high at a minimum. The more premium entries would be above this in the last 10-15 pips (i.e. upper end of the range).
So hopefully you can see how the 50% retracement entry is not only arbitrary, but a complete myth, and a huge misunderstanding of price action and the pin bar.
Going for a 50% retrace entry each time will get you a retail traders entry, not a professional one.
What we need to be doing as traders is
- Knowing what environment we are in
- Looking at the most recent price action, and
- Then determining our entry and how to trade the price action.
But, it has to be asked what was the end result of this 50% play?
The Euro naturally went above the pin bars top, stopping just under the range high, and thus stopping out those who entered on the 50% entry.
In Summary
When you breakdown this arbitrary entry method to trading the pin bar, and start really paying attention to the most recent price action context, along with how PA really works, you will begin get a better understanding of how to trade both pin bars, and price action as a whole.
This skill works for any pattern, environment, pair, time frame, or instrument.
Thus, I hope you found this article both challenging & provocative, but more importantly – insightful on how to trade pin bars, and price action as a whole.


