Want FREE Trading Charts For Forex, Stocks or any asset class? Check out our top charting provider Trading View.

Check out my latest video How To Day Trade Stocks Using Volume

Want my Price Action Course for FREE? Click here to find out how.

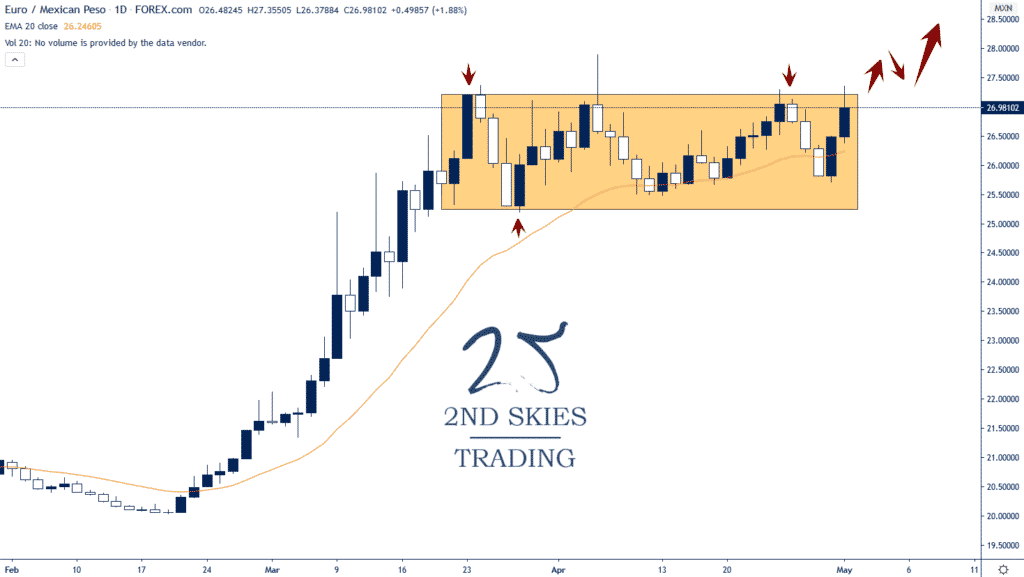
Forex Trade Idea: EURMXN – Corrective Structure At Top, Looking For Breakout (daily chart)

Price Action Context

The EURMXN forex pair has been consolidating in a corrective structure near the top of the trend since late March, so over a month now.

I’m suspecting a breakout is coming soon, more likely to the topside, so am looking for a breakout trade.

eurmxn forex pair 2ndskies trading

Trending Analysis

ST neutral inside the corrective structure, but MT bullish while above 25 on a daily closing basis.

Key Support & Resistance Levels

R: 27.21, 27.90

S: 25.25, 23.90

Stay tuned to our members market commentary for updates.

******

Index Trade Idea: S&P 500 Showing More Signs Of Weakening (daily chart)

Price Action Context

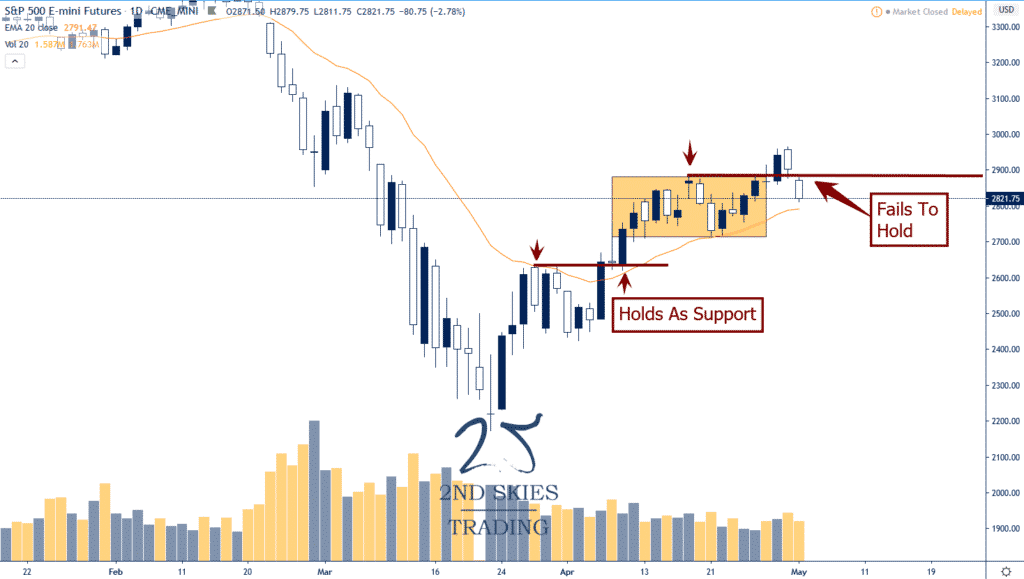
After an impressive low volume bounce since late March from sub 2200 to almost taking out 3000, the S&P 500 has started to show some signs of weakness in the price action.

Of particular note is how the 2nd leg high (unlike the first) did not hold on a pullback and thus broke to end last week.

Still, the S&P 500 needs more technical weakness to call this run over, and breaking below the 20 EMA & dynamic support would further add to this case.

s&p 500 trade idea 2ndskies

Trending Analysis

ST bearish while below 2890 on a daily closing basis, but MT bullish until daily close below 20 EMA.

Key Support & Resistance Levels

R: 2885, 2960

S: 2788, 2630

******

Want FREE Trading Charts For Forex, Stocks or any asset class? Check out our top charting provider Trading View.

Check out my latest video How To Day Trade Stocks Using Volume

Want my Price Action Course for FREE? Click here to find out how.

Forex Trade Idea: EURMXN – Holding Dynamic Support, Potential Breakout (daily charts)

Price Action Context

As we wrote in our ‘Is the stock market going to crash?‘ article, we suggested shorting EM FX, particularly MXN, RUB & ZAR.

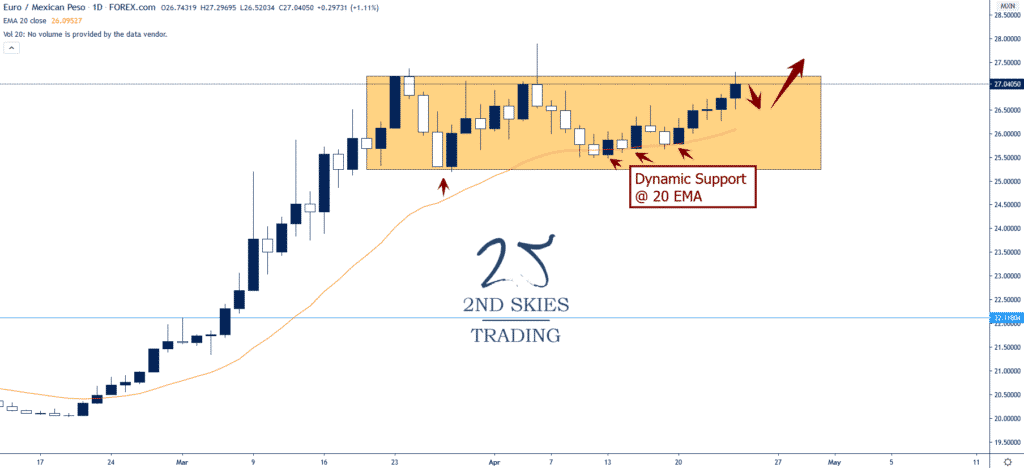
The EUR has been particularly strong against MXN and has formed a corrective structure at the top of its recent bull move (yellow box).

With pullbacks holding at dynamic support (20 EMA) and continuing to press the highs, I’m suspecting this will form a breakout setup to the upside.

eurmxn breakout setup 2ndskiestrading

Trending Analysis

ST & MT bullish while above 25.25 on a weekly closing basis. Watching for breakout setup to get long.

Key Support & Resistance Levels

R: 27.04, 27.85

S: 26.11, 25.20

Stay tuned to our members market commentary for updates.

******

ETF Trade Idea: $SPY – Some Weakening, But Still Bullish (daily chart)

Price Action Context

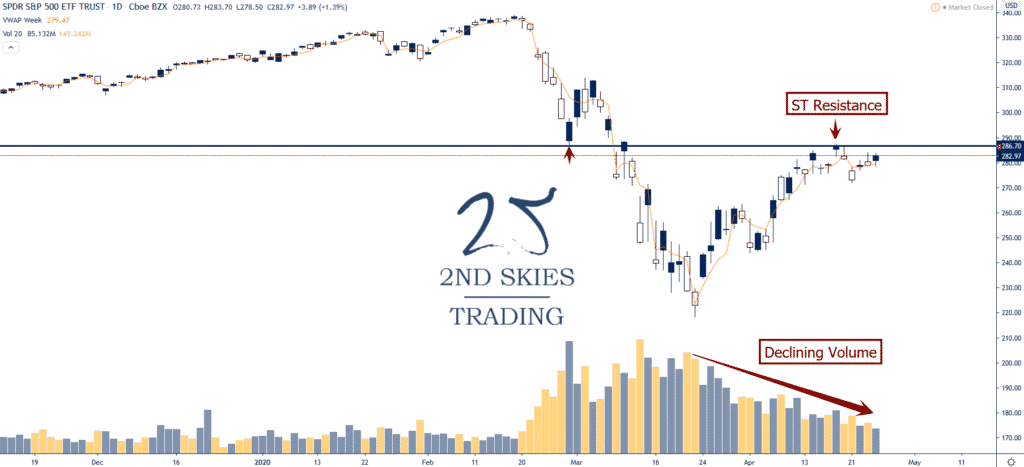
Bouncing with the overall market (on low volume of note), the $SPY (S&P ETF Index) has showed its first signs of weakening being the first week in many to not close or push above the prior weeks high.

This alone is not enough to call the top of this bounce, but its the first sign showing some weakening in the $SPY.

If we start to see more signs in the price action, then it may be slowly starting to roll over as CTA’s and momentum chasers reduce longs.

spy trade ideas 2ndskies

Trending Analysis

ST bullish but MT needs to clear 287.30 to add fresh technical momentum

Key Support & Resistance Levels

R: 287.30, 302

S: 272, 262

******

Stock Trade Idea: $SPG – Barely Holding Lows, Potential Downgrade (daily chart)

Price Action Context

Commercial real estate has been getting clobbered with foreclosures and missed rents as of late.

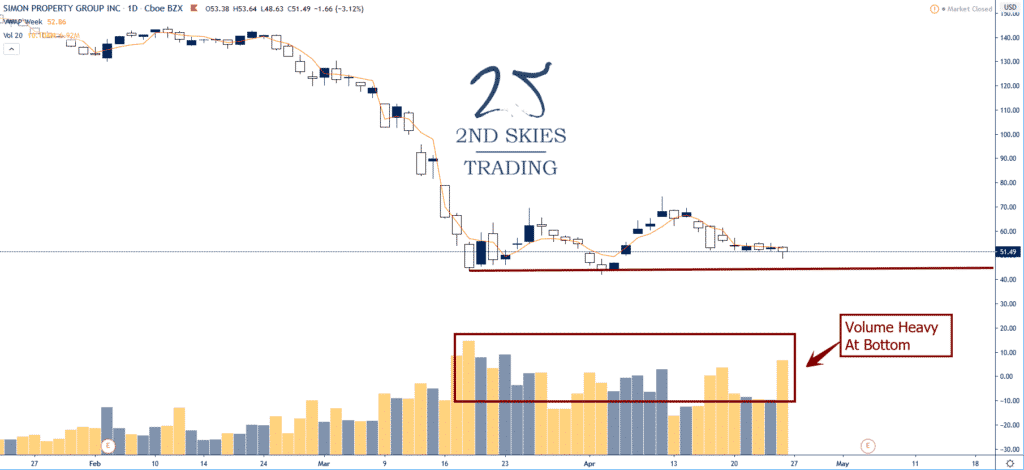
Simon Property Group ($SPG) hasn’t been spared and cannot seem to get up off the mat, barely holding above the lows while others have rebounded. 

Take that + a potential downgrade and you have a recipe for low buying interest and a potential breakdown.

spg simon property group downgrade

Trending Analysis

ST & MT bearish while below 70 on a weekly closing basis.

Key Support & Resistance Levels

R: 68.63, 73.83

S: 43.78, 40

Want FREE Trading Charts For Forex, Stocks or any asset class? Check out our top charting provider Trading View.

Check out my latest video How To Day Trade Stocks Using Volume

Want my Price Action Course for FREE? Click here to find out how.

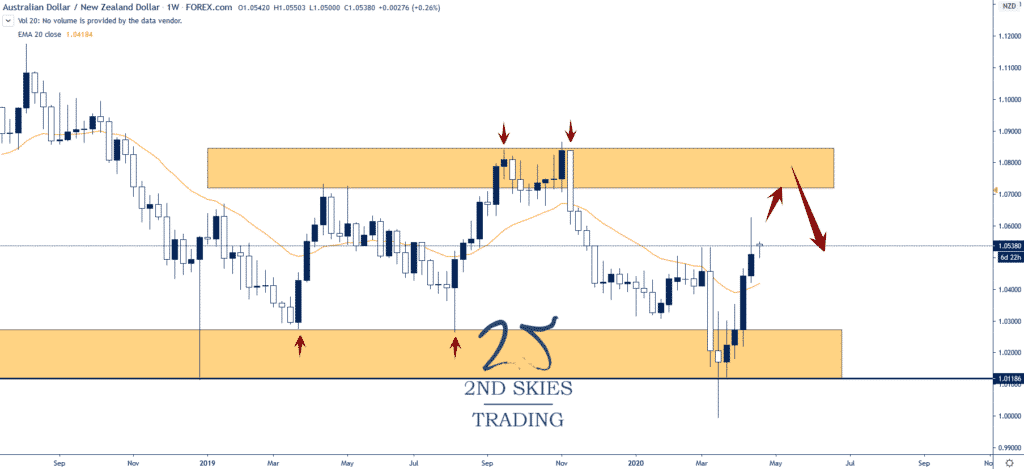
Forex Trade Setup: AUDNZD – Looking to Sell On Rallies (weekly chart)

Price Action Context

After probing the parity level in early March, the AUDNZD has rallied 4 of the last 5 weeks and is looking to retest the major resistance zone ahead between 1.07 and 1.0842.

I’m looking to sell this pair on rallies into the zone and am watching for trade setups to get short.

audnzd forex trade idea 2ndskies

Trending Analysis

ST bullish but MT neutral while inside this larger range between 1.0842 and 1.0118

Key Support & Resistance Levels

R: 1.07, 1.0842

S: 1.0274, 1.0118

Stay tuned to our members market commentary for updates.

******

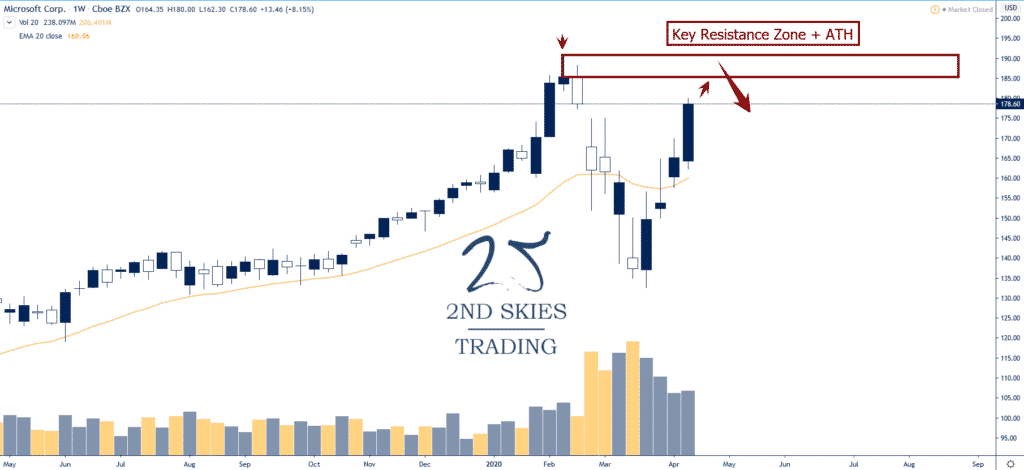
Stock Trade Idea: $MSFT (Microsoft) – Likely Profit Taking At ATH’s (weekly chart)

Price Action Context

One of the stocks we talked about buying in our is the stock market going to crash article was Microsoft ($MSFT). 

Our feeling was the leaders before the crash are most likely going to exhibit strength when it returns, and Microsoft was looking strong before the stock market crash.

Fast forward about 1.5 months and Microsoft is one of the top performing stocks lately, bouncing 34% off its lows and almost back at the ATH (all time high).

What I’m suspecting is current longs are going to take some profit at the ATH’s near 190, thus creating a mild pullback, potentially leading to a decent sell off.

Hence I’m looking to get short at the ATH’s with a tight stop above should we get a weekly close above the ATH.

microsoft trade idea 2ndskiesforex

Trending Analysis

ST very bullish while MT neutral to slightly bullish while below 190.75 on a weekly closing basis.

Key Support & Resistance Levels

R: 183.50, 190.75

S: 151, 135

******

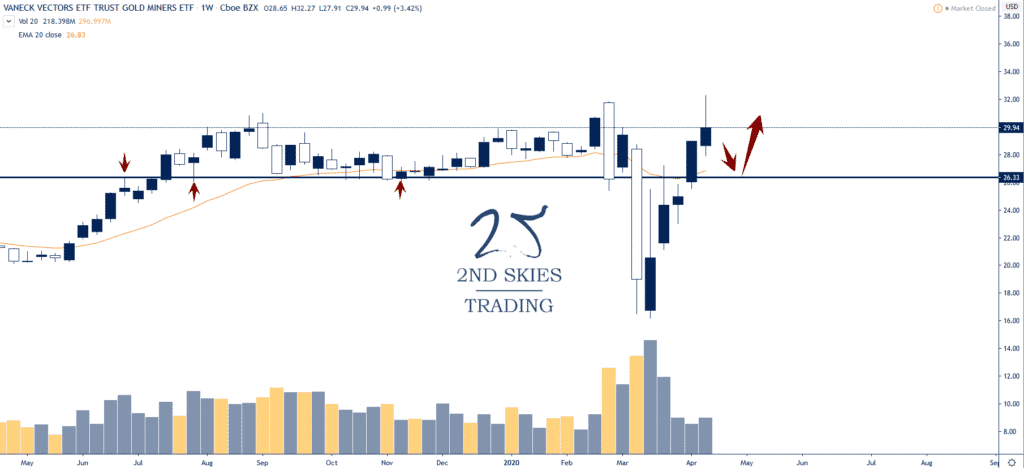
ETF Trade Idea: $GDX (Gold Miners Trust) – Looking to Buy Into Dynamic Support (weekly chart)

Price Action Context

Up 5 weeks in a row and poking at the recent range highs, the VanEck Vectors Gold Miners ETF ($GDX) is looking bullish on a MT perspective.

I’m thinking we’ll get a minor pullback here, but there is a large range of technical support meeting up with dynamic support around 25 which might be a good location to add longs.

$GDX gold miners trust etf trade idea 2ndskiesforex

Trending Analysis

ST & MT bullish while above 25 on a weekly closing basis.

Key Support & Resistance Levels

R: 32, 40

S: 26.42, 24.54

New to Forex? Then check out my FREE Learn Forex Trading Course with videos, quizzes and downloadable resources

Top Trade Review: Check out this Top Forex Trade Review with Itayi profiting +1100 Pips on the NZDJPY (AMAZING PROFIT!)

Want FREE Forex Charts? Check out our top charting provider Trading View.

Did you see my video “Is It Time To Buy Stocks” and whether you should be buying stocks long term?

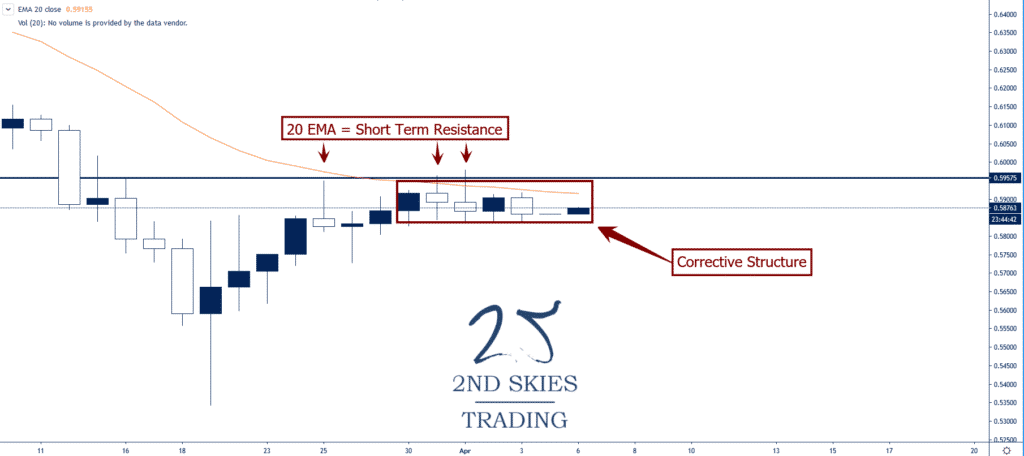
Forex Trade Idea: AUDCHF – Corrective Structure At Dynamic Resistance (daily chart)

Price Action Context

After the V-bottom bounce mid-March, the AUDCHF forex pair has been inside a corrective structure for the last 6 days near the top of this V-bottom bounce and bear market rally.

Interestingly enough the pair has also been held by the dynamic resistance and 20 EMA touching it several times but being unable to close above it.

A weakening in this structure points to a potential attack on 5600 and maybe the recent lows.

However an impulsive break and close above points at a ST recovery.

audchf forex pair 2ndskiesforex

Trending Analysis

ST bullish while inside the corrective structure with strength gaining on a close above and weakness on a close below.

Key Support & Resistance Levels

R: 5957, 6221

S: 5642, 5400

Stay tuned with our members market commentary for updates.

******

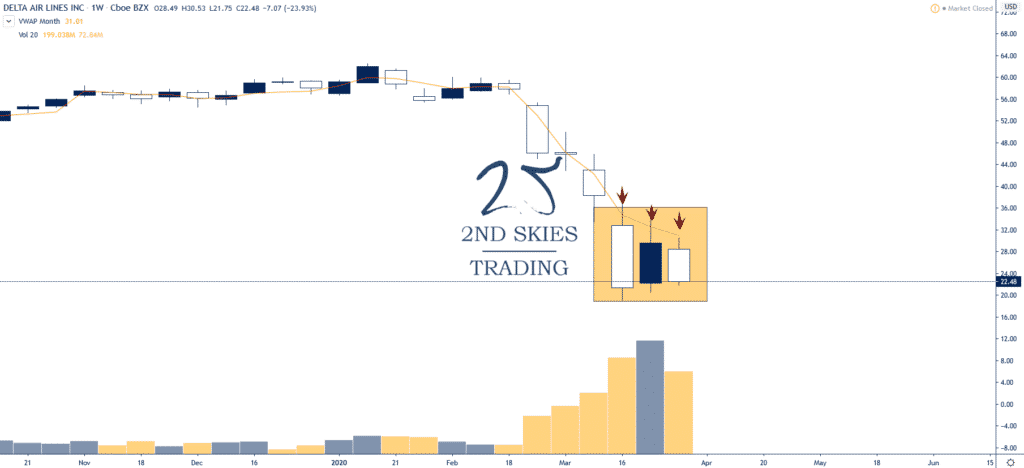
Stock Trade Idea: Delta Air Lines ($DAL) – Watching For Potential Break to Sell (weekly chart)

Price Action Context

Selling off 6 of the last 7 weeks, Delta Air Lines ($DAL) was already under pressure, being held below the anchored vwap over the last 3 weeks, and is pressuring the yearly lows again after last weeks sell off.

But pouring gasoline onto a fire, reports that Warren Buffet has sold 12.9 million shares of Delta should only put more pressure onto the stock.

I’m watching for a break below the yearly lows, or a weak pullback into the anchored vwap for a potential trade setup to get short.

delta air lines stock trading 2ndskiesforex

Trending Analysis

ST & MT bearish while below 36 on a weekly closing basis.

Key Support & Resistance Levels

R: 30.75, 36

S: 19, 15

******

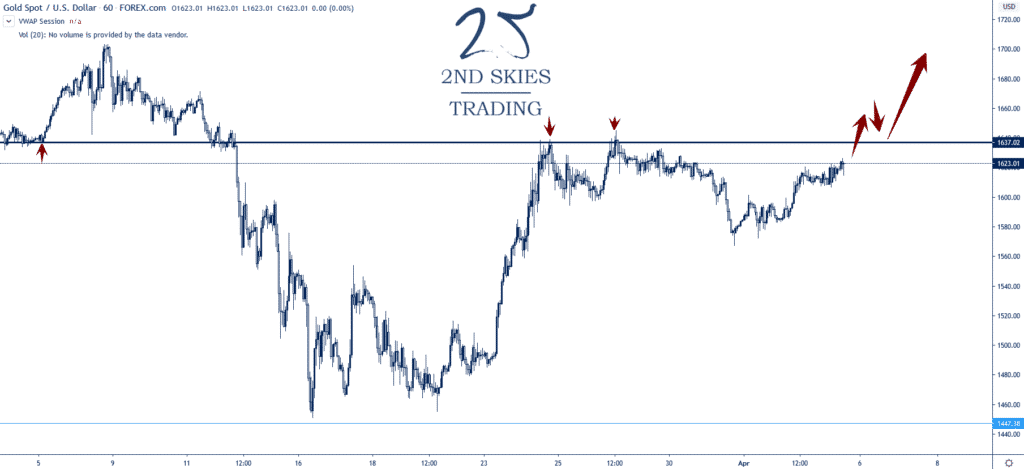
Commodity Trade Idea: Gold (XAUUSD) Showing Resilience In Bull Trend (1hr chart)

Price Action Context

Showing resilience in the bull trend, Gold started off the week selling off towards the 1450 key support level before correcting and then bouncing impulsively, making up the losses faster than it sold off.

This tells us the bulls still have the majority of control and are looking to break higher this week.

gold bull trend 2ndskiesforex

Trending Analysis

ST & MT bullish while above 1450 on a weekly closing basis. Am looking to get long on a break above 1640.

Key Support & Resistance Levels

R: 1640, 1690

S: 1567, 1450

******

New to Forex? Then check out my FREE Learn Forex Trading Course with videos, quizzes and downloadable resources

Top Trade Review: Check out this Top Forex Trade Review with Itayi profiting +1100 Pips on the NZDJPY (AMAZING PROFIT!)

Want FREE Forex Charts? Check out our top charting provider Trading View.

Did you read my ‘Is the Stock Market Going to Crash‘ article? If not, make sure to read it for trading tips.

Forex Trade Idea: EURUSD – Approaching Base Of Support & ATL (weekly chart)

Price Action Context

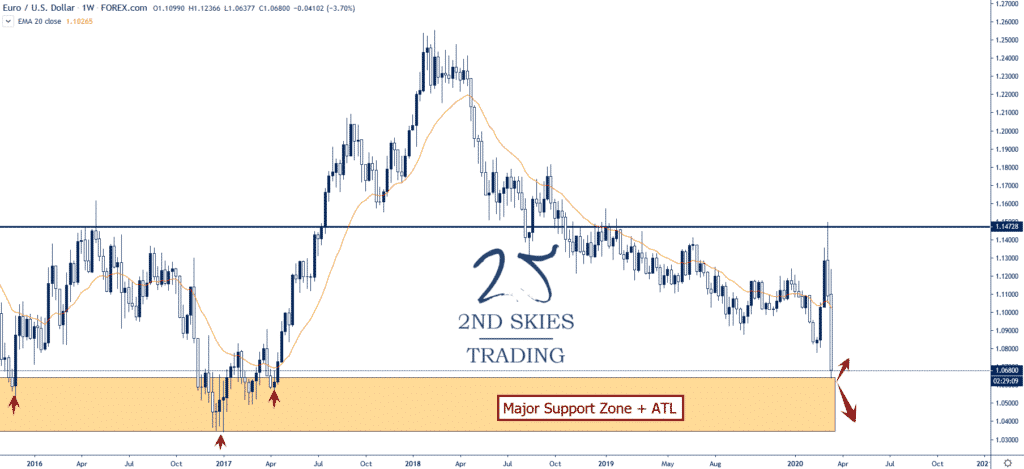
After a brutal V-shaped sell off from the two week rip up, the Euro has been punished dropping almost 8 handles in the last two weeks.

The forex pair is currently approaching a large base of support and the all time lows (ATL) between 1.0680 and 1.0348.

Right now there is a shortage of USD’s out there and thus a major reason why the USD is performing well now, so I’m expecting this support zone to be penetrated and tested.

If we break the ATL mid 1.03’s, then I’m expecting some technical stops to be tripped at 1.01 and a potential attack on parity so look for a weekly close below.
Trending Analysis

ST bearish and MT neutral while above this zone.

Key Support & Resistance Levels

R: 1.12, 1.1472

S: 1.068, 1.0345

Stay tuned to our members market commentary for updates.

******

Stock Trade Idea: Zoom Video Communications ($ZM) – Should Benefit Long Term (weekly chart)

Price Action Context

With a lot of companies having their employees work from home, video conferencing is set to benefit.

Now while many of these companies are seeing their stocks surge, I don’t think its going to evaporate when the corona-virus subsides and life goes back to normal.

I am thinking many companies will be realizing they can function just fine with large portions of their workforce working from home.

Hence I’m suspecting that even when life normalizes after this virus, more and more companies will be embracing video conferencing.

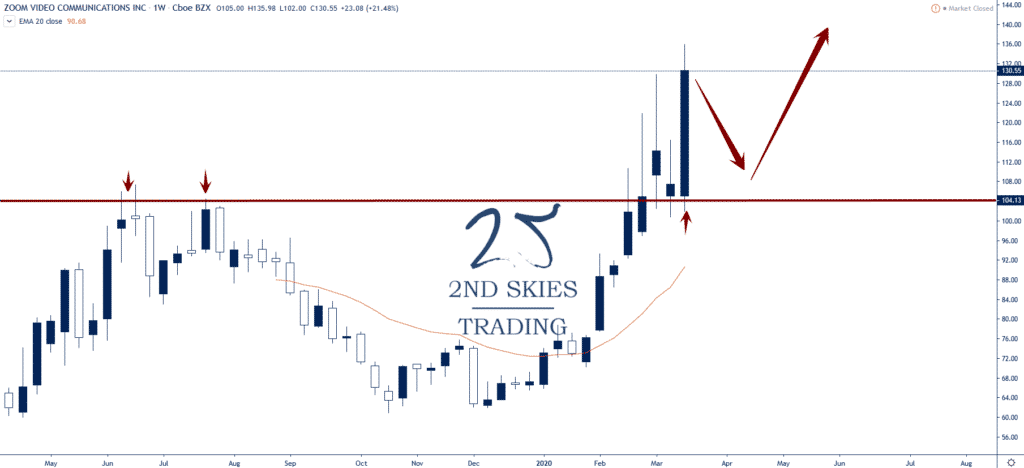
Enter Zoom (which we use) whose stock is up an impressive 68% since the beginning of Feb.

I think if we get a decent pullback in the stock, I’m looking to go long for a long term bet video conferencing will thrive in the coming years and Zoom will be a big beneficiary of that.
zoom stock

Trending Analysis

I’m watching the role reversal level around 104 as a potential buy point, ideally on a corrective pullback.

Key Support & Resistance Levels

R: 135, 150

S: 104, 75.67

******

Commodity Trade Idea – Gold ($XAUUSD) – Likely Sold To Fund Losses, Potential Support (weekly chart)

Price Action Context

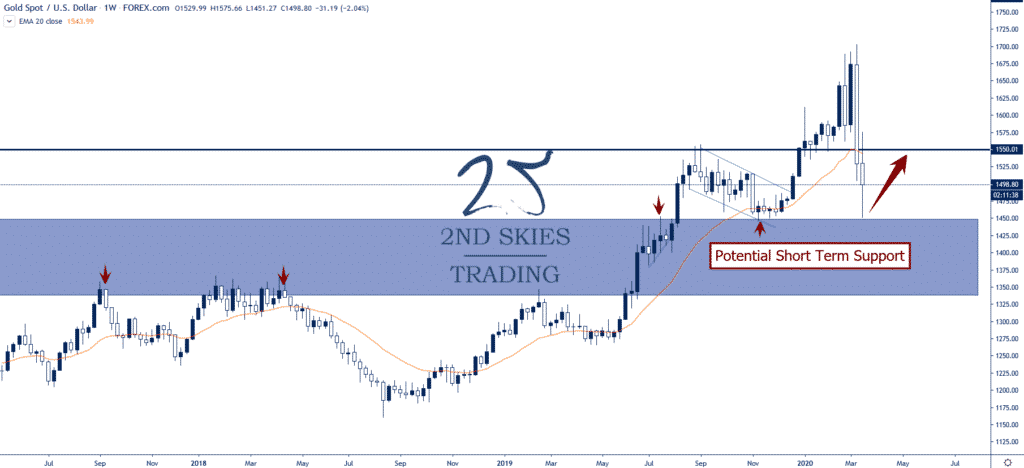
In the last two weeks, gold has been selling off aggressively.

A lot of traders have been associating gold with a risk off in this case, but if that was the case, why didn’t it start selling off earlier in the market crash?

I think gold has been sold recently as a ‘funding‘ trade to offset losses in other aspects of their portfolio.

Hence I think gold might be trying to bottom around 1450, and there may be a potential short term trade setup here.
                                              

Trending Analysis

ST bearish but MT bullish while above 1450 on a weekly closing basis.

Key Support & Resistance Levels

R: 1550, 1675

S: 1450, 1350

******
New to Forex? Then check out my FREE Learn Forex Trading Course with videos, quizzes and downloadable resources

Top Trade Review: Check out this Top Forex Trade Review with my student banking +377 Pips on the EURUSD (HUGE REVERSAL!)

Want FREE Forex Charts? Check out our top charting provider Trading View.

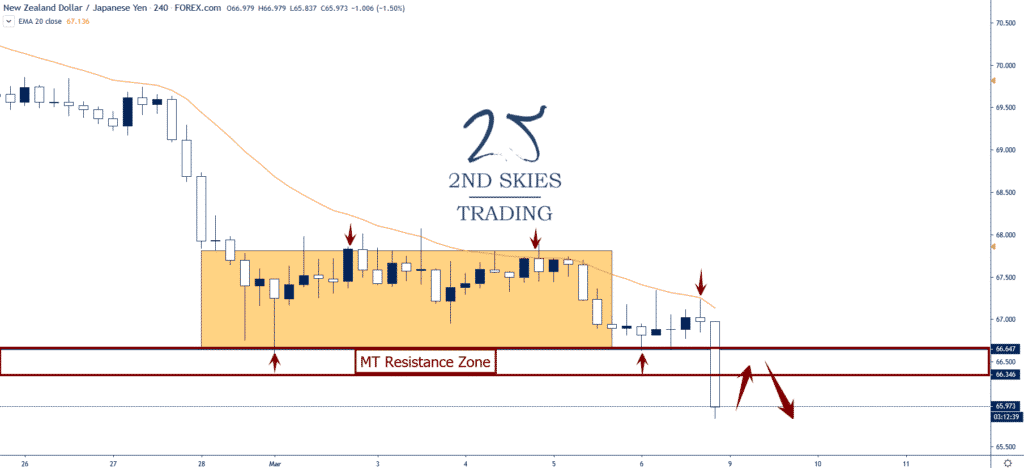
Forex Trade Idea: NZDJPY – Breaks Key Support Zone, Looking to Sell (4hr chart)

Price Action Context

On our youtube channel last week we talked about the NZDJPY forex pair and how we were bearish looking to sell.

To open the market this week, the NZDJPY forex pair sold off aggressively opening below the major support zone between 66.33 – 66.63 printing below the 66 handle.

I’m looking to sell on a pullback into resistance.

nzdjpy

Trending Analysis

ST & MT bearish while below 67.75 on a weekly closing basis.

Key Support & Resistance Levels

R: 66.63, 67.99

S: 63.45, 60.45

Stay tuned on this with our members market commentary for updates.

******

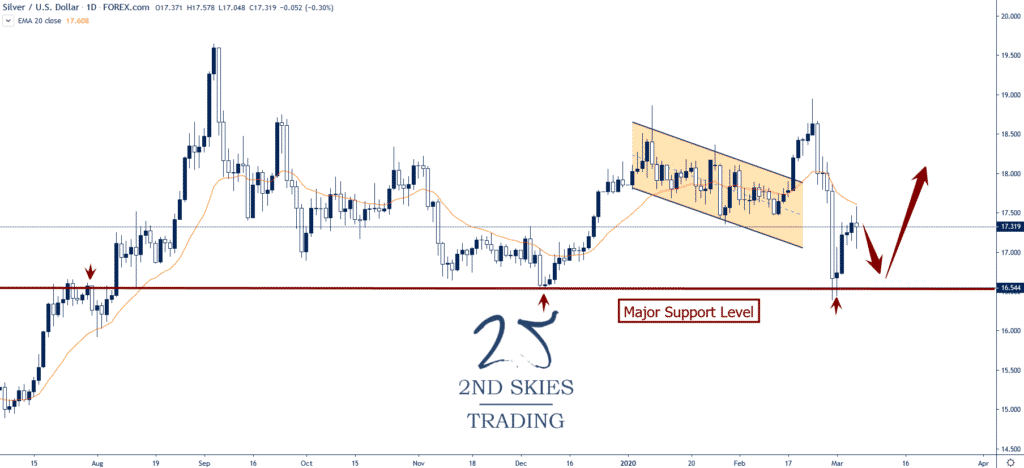
Commodity Trade Idea: Silver – Weaker Than Gold, But Holding Key Support Level (daily chart)

Price Action Context

Since August of last year, Silver has been holding steady above a key support level at 16.54. 

This level was tested last week after a brutal 4 day sell off in the precious metal from just under 19 to 16.54 in 4 days. 

The PM held and has bounced decently, showing through the price action and order flow the bulls are able to hold (for now).

I’m looking to stay long MT till we get a close below this level on a weekly closing basis.

silver major support level 2ndskiesforex

Trending Analysis

ST bullish and MT neutral while stuck between 19.50 and 16.54.

Key Support & Resistance Levels

R: 18.63, 19.59

S: 16.54, 15.75

******

Stock Trade Idea: United Airlines ($UAL) – Looking to Sell Below Key Support (weekly chart)

Price Action Context

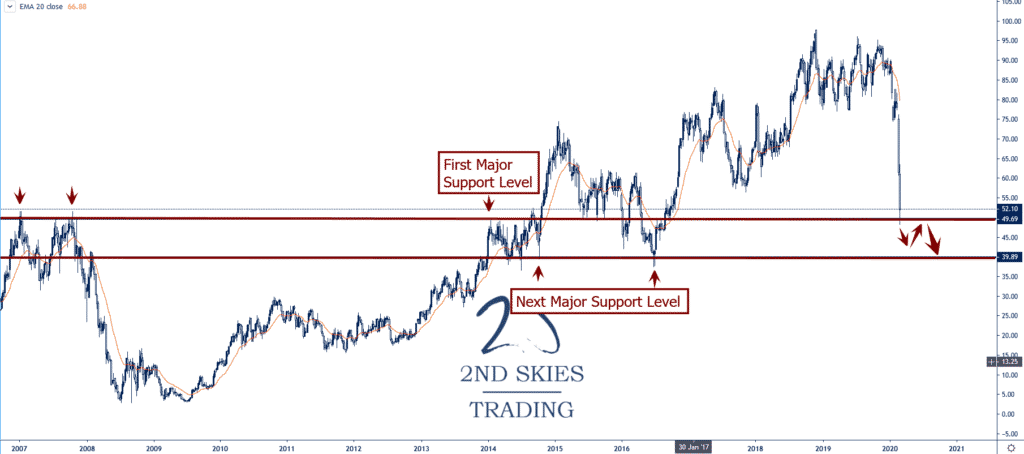
As we talked about in our latest article “Is the stock market going to crash“, we suggested selling airlines due to the coronavirus spreading and that travel/entertainment companies would get hammered.

If you had shorted any of the travel/entertainment companies like we suggested, you would have profited heavily from this.

Nothing has abated with the coronavirus and naturally, less people are flying and travelling.

This bodes really bad for airline companies, including United Airlines ($UAL).

Right now we’re just barely above a major support level around 49.69, but if this breaks, then there isn’t much below till 40 so a potential stock trade setting up.                                                                                            

united airlines stock trade idea 2ndskiesforex

Trending Analysis

ST & MT bearish. Weekly close below 49.75 will increase the bearish pressure and a potential move towards 40.

Key Support & Resistance Levels

R:57.9, 80

S: 49.69, 39.9

******

Chris Capre’s current live open price action & ichimoku trades: USDMXN, EURRUB, EURMXN, BIG, DIS, AC, ISD

New to Forex? Then check out my FREE Learn Forex Trading Course with videos, quizzes and downloadable resources

Top Trade Review: Check out our latest Top Forex Trade Review with my student banking +428 Pips on the GBPAUD (MASSIVE PROFIT!)

Forex Trade Idea: EURUSD – Staying Long Till Momentum Change (4hr chart)

Price Action Context

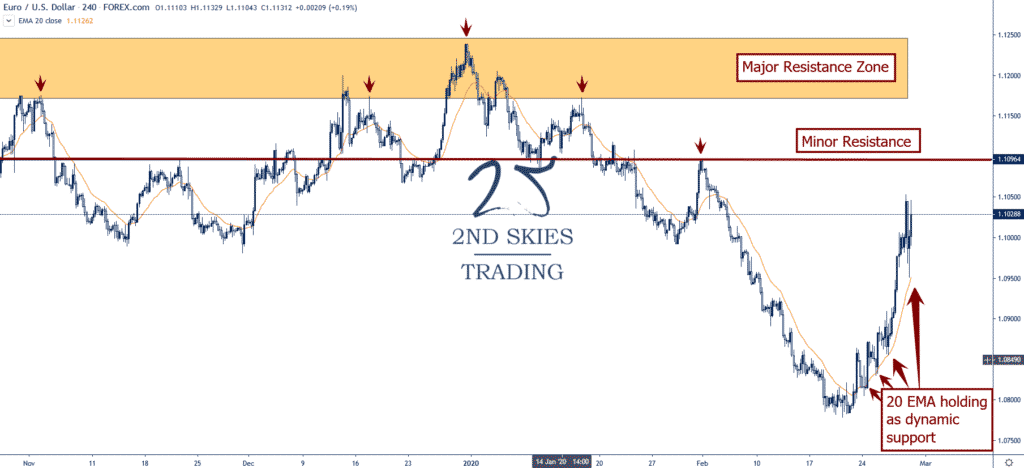
A week ago on our youtube channel we commented on the momentum change in the EURUSD captured by the change in the price action and the 20 EMA.

This is what it means to understand dynamic support & resistance.

The EURUSD call was pretty prescient as the Euro staged an impressive reversal climbing another 200 pips from when we posted that.

Looking at the 4hr chart below, you’ll see how the 20 EMA Held on 4 separate pullbacks suggesting the market is now treating it as support, thus a bullish sign for now.

I’m looking to stay long while we’re above 1.10 and the 4hr 20 EMA on a closing basis.

eurusd dynamic support 2ndskiesforex

Trending Analysis

ST bullish while above the 4hr 20 EMA and 1.10. Looking to stay long under these conditions towards 1.1175 resistance zone.

Key Support & Resistance Levels

R: 1.1096, 1.1175

S: 1.10, 1.0775

Get EURUSD updates with our members market commentary 4x per week.

******

Commodity Trade Idea: GOLD (XAUUSD) ST Bearish But MT Bull Trend In Play (daily chart)

Price Action Context

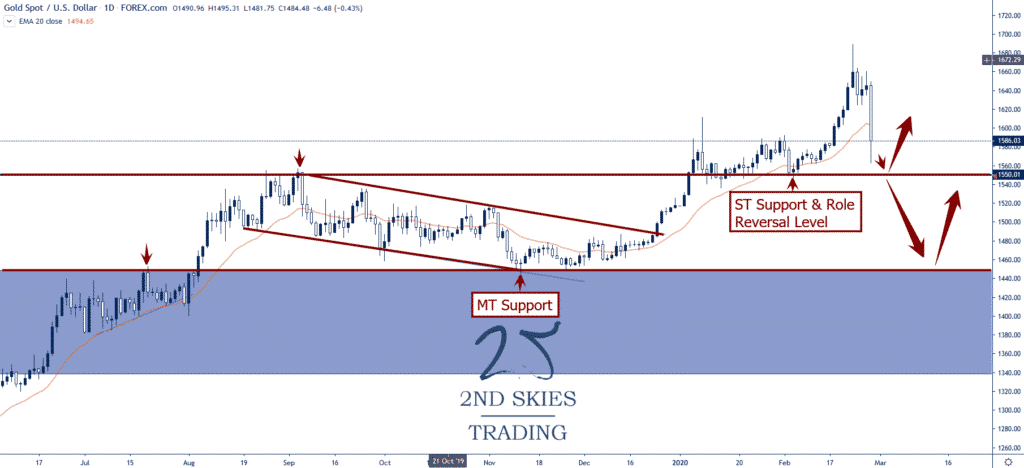
While having an impressive bull run for 2020, Gold puked to end last week with billions being sold and wiping out most of the yearly gains within a matter of days.

My sense is there was a lot of profit taking in gold to subsidize losses from stock holdings (which also took a beating last week).

Regardless, ST gold isn’t my cup of tea, but I think the MT bull trend is still in place with two major support zones in play for potential longs.

gold role reversal leve 2ndskiesforex

Trending Analysis

ST bearish but looking to get long at key role reversal levels.

Key Support & Resistance Levels

R: 1660, 1770

S: 1550, 1450

******

Stock Trade Idea: Boeing (BA) – Collapses Below Large Corrective Structure, Bearish (weekly chart)

Price Action Context

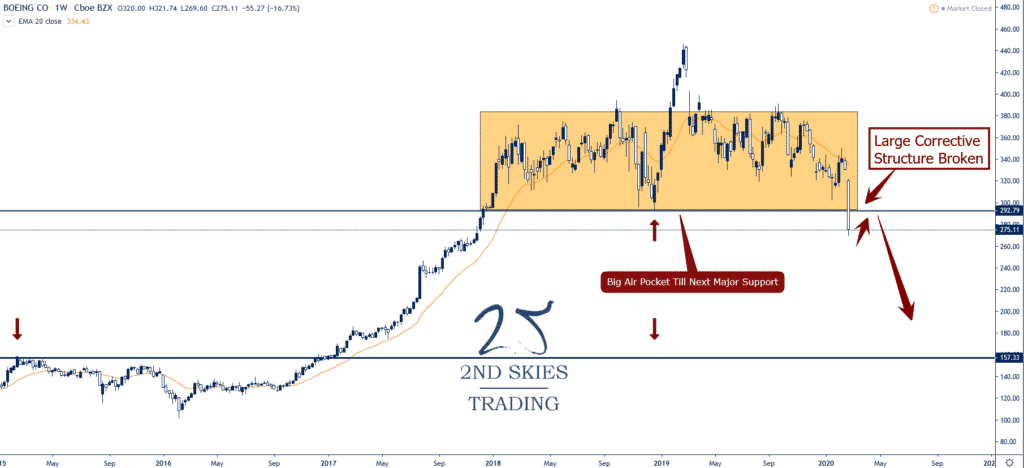
For the last two years, Boeing has had a base of support between 292 and 318 which has supported the stock well and created a lot of good short to medium term trade setups.

However, last week Boeing got hammered closing below the 292 base of the large corrective structure for the first time ever.

NOTE: We called a bearish setup way back at 369 which profited massively for our stock trading members.

IMO, the break below this structure is a very bearish technical event with many MT and LT stops being tripped.

Also of importance is now there is a large air pocket with only thin layers of support for the company, and nothing major till 157, so this could turn really ugly fast for this stock.

boeing stock trade idea 2ndskies

Trending Analysis

ST I’m looking to get short and stay short till we get a close above 292 on a weekly basis. Downside there could be a lot of room to run if none of the minor levels hold along the way.

Key Support & Resistance Levels

R: 292, 318

S: 242, 157

******

Chris Capre’s current live open price action & ichimoku trades: USDMXN, EURRUB, EURMXN, BIG, DIS, AC, ISD

New to Forex? Then check out my FREE Learn Forex Trading Course with videos, quizzes and downloadable resources

Top Trade Review: Check out our latest Top Forex Trade Review with my student banking +158 Pips on the EURCHF nailing a PERFECT ENTRY!

Forex Trade Idea: GBPJPY – Buy & Sell Setups Available (daily chart)

Price Action Context

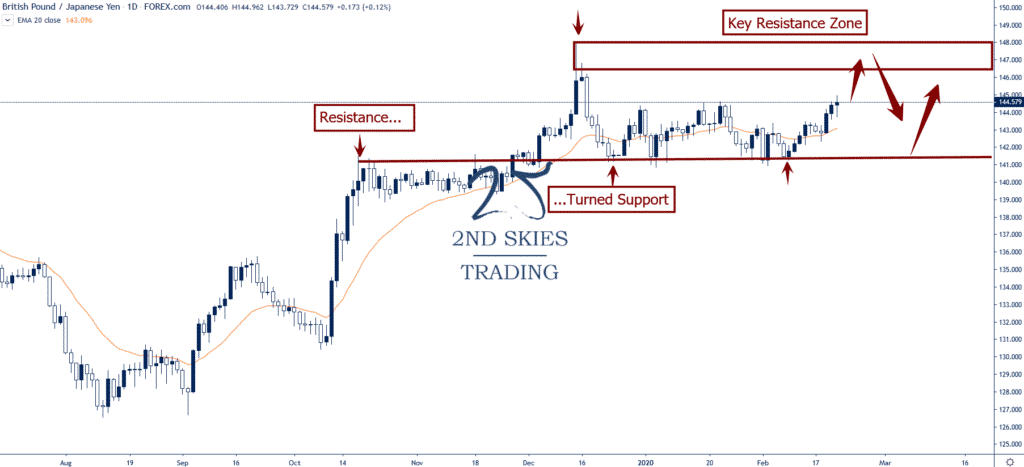
For all of 2020, the GBPJPY forex pair has been stuck in a 325 pip range between 141.25 and 144.50.

The pair however has gained 7 of the last 10 days, and is making an earnest attempt to break the yearly highs.

Doing so would put key resistance zone between 146.60 and 148 into play where likely profit taking will emerge, along with some sellers.

Meanwhile a failure to break the yearly highs would likely put 143 and 141.25 into focus.

gbpjpy forex pair 2ndskies

Trending Analysis

ST & MT neutral while inside the 325 pip range. Watch break for next technical direction.

Key Support & Resistance Levels

R: 146.60, 148

S: 141.25, 139.45

Stay tuned with our members market commentary for updates.

******

Commodity Trade Idea: XPDUSD (Palladium) – Makes New Yearly Highs, Lifts Support Zone (4hr chart)

Price Action Context

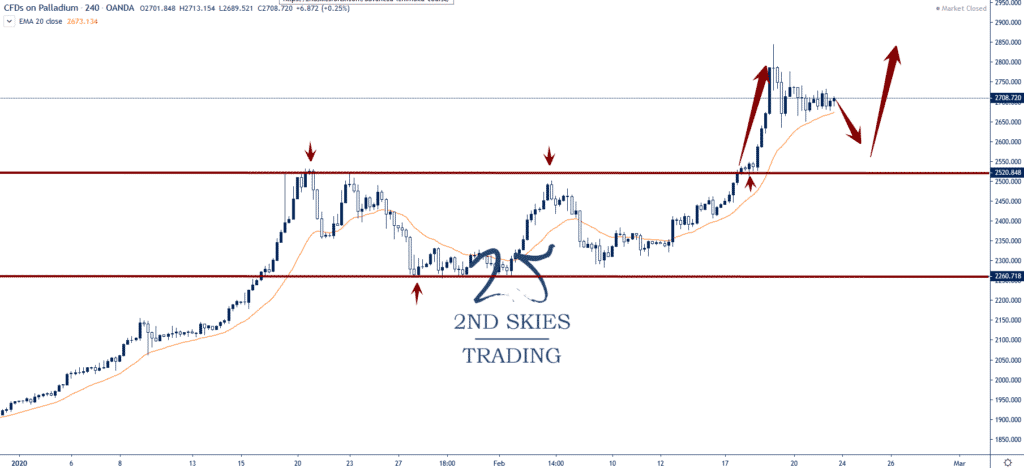
After going gang-busters to start the year, climbing from sub 2K to 2520 last month, Palladium formed a large corrective structure for about a month.

That structure just got annihilated as the precious metal broke through the 2520 resistance ramping up to 2545 in a couple days.

Since then the PM has consolidated its gains while tidily holding above the 4hr 20 EMA (chart below).

palladium bullish setup 2ndskiesforex

Trending Analysis

I’m bullish on Palladium till we get a weekly close below 2500. I’m watching for corrective pullbacks towards support to get long.

Key Support & Resistance Levels

R: 2845, 3000

S: 2520, 2260

******

Crypto Trade Idea: Bitcoin (BTCUSD) – Looking to Buy On A Pullback (daily chart)

Price Action Context

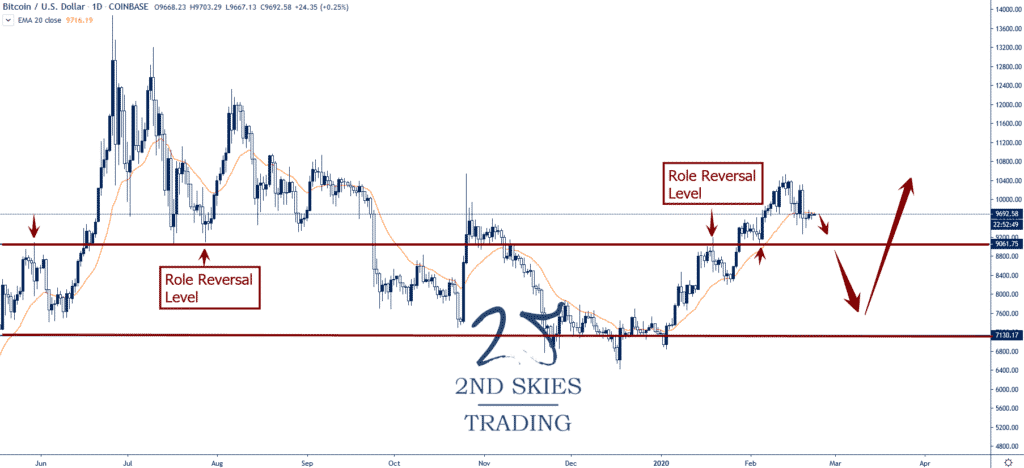
Bitcoin has had a pretty solid start to the year, up +30% on the year.

You’ll notice the strong momentum on the daily chart below in how the price action maintained its bullish position above the 20 ema.

Recently however, the cryptocurrency has played on both sides of the 20 EMA, suggesting the momentum short term is weakening.

To me, the overall bull trend to start the year is in place, but may be taking a pause.

I’m looking to buy a pullback into support with the first potential level being the role reversal level around 9060.

bitcoin trade idea 2ndskiesforex

Trending Analysis

ST neutral but MT bullish while above 7250 on a weekly closing basis.

Key Support & Resistance Levels

R: 10450, 12000

S: 9060, 7130/7250

******

Chris Capre’s current live open price action & ichimoku trades: USDMXN, EURRUB, EURMXN, BIG, DIS, AC, ISD

New to Forex? Then check out my FREE Learn Forex Trading Course with videos, quizzes and downloadable resources

Top Trade Review: Check out this weeks Top Forex Trade Review with my student banking +158 Pips on the EURCHF nailing a PERFECT ENTRY!

Forex Trade Idea: EURGBP – Approaching Multiple Layers of Resistance (daily chart)

Price Action Context

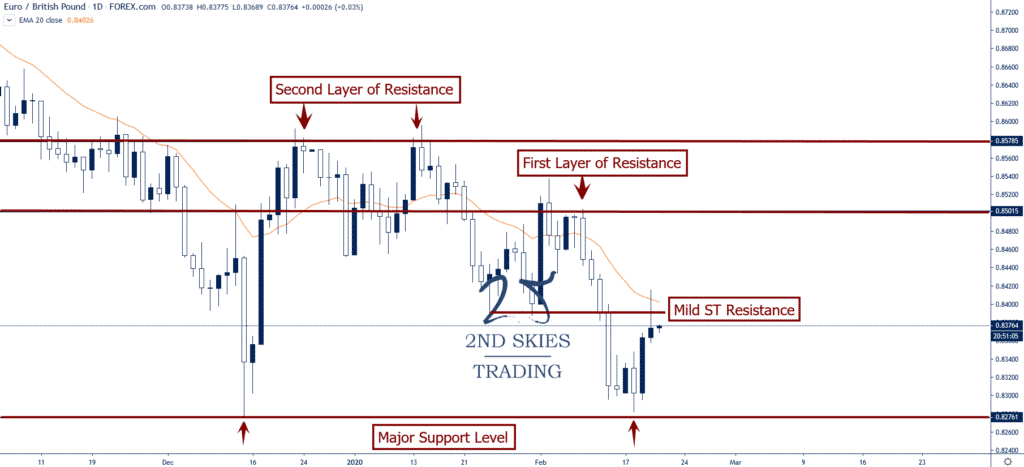
Currently in a corrective structure on the bottom of a downtrend, the EURGBP has bounced of a multi-year support level near 8276 over the last two days.

However, the pressure remains on the EURGBP (along with many EUR pairs) and multiple layers of resistance lie ahead for the forex pair, so we are looking to sell higher up.

eurgbp layers of resistance levels 2ndskiesforex

Trending Analysis

ST Neutral while inside the corrective structure but MT bearish while below 8600 on a weekly closing basis.

Key Support & Resistance Levels

R: 8501, 8575

S: 8276, 8100

Stay tuned with our members market commentary for updates.

Chris Capre’s current live open price action & ichimoku trades: USDMXN, EURRUB, EURMXN, BIG, DIS, AC, ISD

New to Forex? Then check out my FREE Learn Forex Trading Course with videos, quizzes and downloadable resources

Top Trade Review: Check out our latest Forex Top Trade Review with Sascha (our Course Instructor) nailing it for +201 Pips!

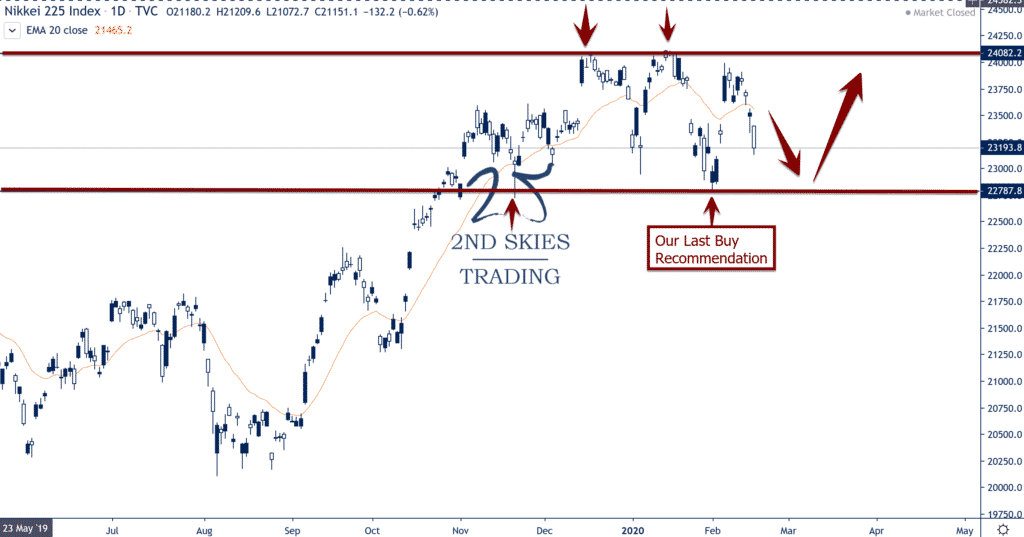
Index Trade Idea: Nikkei 225 – Approaching Key Support Level, Looking to Buy (daily chart)

Price Action Context

In our recent market commentaries, we talked about the Nikkei 225 and noted a potential buy location around the key support level near 22787.

As you can see from the chart below, that level held and produced a very profitable trade setup for over +1000 points.

Congrats to the members who profited from this trade setup.

For now, the structure is still in play, along with the key support level, so am looking to buy on a pullback into the level targeting the recent swing highs.

nikkei 225 buy setup at key support level 2ndskiesforex

Trending Analysis

ST neutral while inside the large corrective structure. MT bullish while above 22787 on a weekly closing basis.

Key Support & Resistance Levels

R: 23884, 24082

S: 22787, 22158

Check back for updates with our members market commentary.