One of the more difficult aspects for traders is placing highly effective stops. Either most beginning traders place stops too tight or too far away. Place stops too close to your entry and they are likely to get hit. Too loose and they unbalance your risk/reward ratios.
In today’s article, I’m going to share 2 tips for placing highly effective stops and how these can help you increase your accuracy and profit potential.
1) The Reason You Entered the Market
You should always have a reason to enter the market. Ideally it based on a price action pattern that has repeated itself in the past, and will likely do so again. All patterns have variables that repeat themselves, and it is this ‘repeating‘ we want to happen again, thus allowing us to profit from a predictable event.
If the reason you bought a pair was because the dynamic support and 20ema was holding on the 4hr chart several times, then your reason to exit should be a violation of this.
I recently wrote in my market commentary how the S&P 500 bounced 4x off the 20ema. If the reason for buying was the anticipation price would bounce off the 20ema again, then my reason for exiting would be the opposite of this happening. Today this is exactly how it played out, bouncing for a 5th time, and offering a trader to profit from it greatly (see chart below).

Now if the price action breaks and closes below the 20ema (something it has not done in 11 days), then the pattern has broken down, and it is no longer a tradable event.
But in terms of placing a stop with this trade setup, we could have looked for the largest breach below the 20ema over the last 11 days, and placed our stop just below this upon entry. Had you done so, you could have easily grabbed a 3x reward play on the last 20ema touch.
2) Stops Are Best Placed Above/Below Support & Resistance Levels
Institutional traders place their orders around levels more than anything else. When many orders from a lot of players with a lot of money, occur at a particular price, it often creates a strong reaction at a level. And when price ‘reacts‘ to this level more than once, it often becomes a key support or resistance level.
Thus, stops are best placed above or below key support and resistance levels. It is here that the larger players are placing their orders, and thus likely to defend your entry and stop.
If you do, then in following the logic of rule #1, we should be getting out of the trade if the level is clearly breached.
Lets take both sides of a potential trade below and see how we could have placed our stops effectively buying or selling.
EURUSD 4HR Chart

Starting with the left side of the chart above, we have a strong impulsive price action bull run, that finds sellers just below 1.3400 , or point 1. This selling pulls back to A where it finds support around 1.3250, and then re-attacks the sellers just below 1.3400 again at point 2. Now if you were a seller, and had seen price hold just below 1.3400 2x, and sold at pt 2, the logical place would be to put it about 10 pips above the round number, while targeting the buyers around 1.3250.
Why 10 pips above 1.3400?
Because this is a round number, statistics show typical stops for selling orders placed at round numbers are often within the first 9 pips above (so 1.3400-1.3409). Of course, always make sure price action confirms this, but this is a general rule you can use.
Now if you want to be a buyer in this case – taking a with trend continuation play, then buying at B or C, with a stop 10-15 pips below 1.3250 would have also worked out, targeting the resistance at 1.3400.
Now trades will not always be this clean in terms of support and resistance levels, which leaves you two options;
1) Only trade when the price action is really clean
or
2) Learn to place really efficient stops
I understand the latter may be more difficult to do, but you can find more high probability setups by adding a key component.
Impulsive Moves
One way to increase your chance of having a profitable trade, and placing an efficient stop, is to trade with trend more than counter-trend. When trading with trend, the majority of the order flow is already on your side, so look to consistently trade with impulsive price action moves, not corrective ones. If you can do this, then you will build your confidence in placing efficient stops, because you are getting in with the larger players.
A great example of impulsive and corrective moves is in the chart below.

You will clearly see how much more profitable one would be selling the impulsive moves (white boxes), and not the corrective moves (green ones). When you can learn to spot and trade with these moves, you will find your stops tend to get hit less, and your full profit targets achieved.
One Final Note
It should always be noted, when a beginning trader looks at a trade, they see profit first, and risk second. A professional on the other hand, looks at controlling risk first, then profit second. So once you have a trade idea and potential entry, figure out your stop – which should be placed where the market should not go if you are correct.
From here, calculate your risk in pips, and then find a target which can be easily achieved with consistency. If the math works, then pull the trigger, and let the trade play out.
In Summary
Placing stops tends to be one of the more confusing things for beginning traders, as they are often placed too far or too close to your entry. By learning to place stops close to key support and resistance levels, you will find they are more well defended than it no-mans land.
Also, by placing stops based on what the market should not do if you are correct, then you will find your stops get hit a lot less.
Lastly, when trading with impulsive moves, you increase the probability your trade will be profitable since you are trading with the flow of the larger players.
To learn rule based systems for placing effective stops, limits, entries and exits – make sure to check out my Price Action Course.
Kind Regards,
Chris Capre
Tag Archive for: impulsive price action
Today’s price action tip article is designed to give any beginning, or non-profitable trader, 2 critical tips to help accelerate your learning curve and avoid the pitfalls almost everyone falls into. If you can learn to follow these two beginner forex trading tips, then you will find yourself making more winning trades, along with less mistakes that tend to get you in trouble.
Trading is already hard enough, regardless of your level, so integrating these two tips will help you to make more winning trades.
Tip #1: Trade Only When The Price Action & Direction Is Clear
Although this may seem confusing for the beginner, as price action rarely seems clear, there is actually a simple model to determine whether the price action and direction is clear.
The model I use daily to determine the direction/clarity of the market is looking for impulsive price action moves. To briefly sum it up, impulsive price action is when the institutional players (those that move the market) are either heavily buying or heavily selling the market. You can spot these moves by three simple characteristics;
1) The bars are quite large
2) They are mostly one color
3) They have closes towards the highs or lows (in the direction of the move)
When you see these three things, you almost always have an impulsive move. And when you have an impulsive move, those that move the market are predominantly pushing it in one direction, which is the direction you want to trade with. When you can find the correct direction, and trade it, you give yourself the greatest probability of making money.
An example of some impulsive moves are below, and you will see when looking at the chart, you will definitely want to be trading in that direction.
Looking at the chart above, you will see two colors of boxes; White and Green. If you look at all the white boxes above, you will all notice they have the three characteristics of impulsive moves described above.
Compare them to the green boxes – these have the opposite of the 3 characteristics of impulsive moves. These are called corrective moves, and for beginning traders, they should be avoided as a whole. When in doubt, if you do not have a clear market or impulsive moves, avoid trading.
Often times for beginning traders, finding the right direction is difficult, and it seems like you tend to find the opposite side of the move. By learning to only trade with impulsive moves and the price action is clear, you are saying to yourself, ‘I’m only going to fish when the easy fish are around’.
Tip #2: When Trend Trading – Best to Buy or Sell When the Prior Bar Closes in Your Direction
This is a general rule I suggest to use until you get really good at trading trends. The reason for this is simple;
a) If you are looking to buy in an uptrend, you have a greater chance of being correct when the last bar to close, closed bullish.
b) If you are looking to sell in a downtrend, you have the greater chance of being correct when the last bar to close, closed bearish
If you think about it – when looking to buy in an uptrend and the last bar closed bullish, it is a confirmation for the last candle (and time), the bulls were in control. This bullish close is more likely to inspire bulls the trend is still alive.
Contrast this to buying when the bears demonstrated control on the last bar. This means they dominated the order flow for that bar, and may be pushing against your orders. This increases the chance the bulls will take profit after seeing a bear bar as opposed to a bull bar (continuation).
However, if the bulls demonstrated control on the last bar, then they are likely still present pushing the market in your favor, so this gives you a greater probability to have follow through on your trade when you enter the market.
Two examples are below.
In this chart, we clearly have an uptrend, which offers a couple of with trend pullbacks. In these pullbacks, you will see two PBL’s (Pullback Lows), which led to a breakout of the prior SH (Swing High) for the trend. You will notice in both of them, the low for the pullback was a bull candle, and the follow up price action was a strong series of bull candles to follow.
Another example is in the chart below on the EURJPY 4hr Chart

In this chart, we have 3 major with trend pullbacks, and in two out of three of them, the PBL’s had a bull bar at the bottom, also demonstrating this principle. As a general rule, bulls will feel more confident buying a pullback (or breakout) in a trend, when the last bar closed bullish. This is a stronger communication the bulls have been able to take control of the price action and order flow for the last bar.
In Summary
Trading is already challenging enough, and finding the right direction is one of the most crucial aspects to making good trades. In the beginning, you already have enough to think about, so try to keep it simple, and trade when the direction is clear. Look for impulsive price action moves as much as possible, and when you find them, trade in that direction.
However, when the price action is not clear, try to stay out until a clear signal and market emerges.
When trend trading, you have a much better chance in the beginning, if you buy/sell when the last bar closes in your direction. This closing in your direction is a clearer communication from the market, the bulls/bears are more likely in control, and in your favor.
I hope these two beginner forex trading tips help you.
To learn more price action techniques and systems, make sure to check out my price action course where I have a large community of traders, posting live trade setups daily, and I teach them how to read and trade price action.
The learning process never ends for a trader. The market is always evolving and you have to adapt. Algorithmic trading was about 3% of the FX market in 04′. Now 28% of it is just HFT’s alone! Think that has changed the intraday price action? Absolutely!
Thus, you must always be learning, evolving and challenging yourself. There are always refinements and greater depths to what you are doing, whether you are trading price action, ichimoku or other rule based systems.
Regardless of your skill level in trading, you are going to make mistakes. I make mistakes, but I learn from them with alacrity. I quickly analyze what I did wrong, visualize what I would do differently, clear my mindset and get back to business. The difference between a professional & beginning trader is usually two-fold;
1) they make less of the typical mistakes beginners do
and
2) they rebound much faster, control the damage quicker and get back to business
Analyze your last year of trading in your journal. I’m willing to bet if you eliminated just one or two mistakes you continually repeat, your current losing year would have been a profitable one. If you ended the year break-even, then it likely would have been highly profitable.
Eliminating mistakes is one of the fastest ways to profitability. The sooner you discover, eliminate and transform them, the faster your equity curve will climb.
Thus, in the spirit of this, I will share my top trading mistakes for 2012 in the hopes you can learn from them.
1) Trading and Investing are Two Different Things
I am a trader first and foremost, but I also am invested long term in physical gold.
To ‘invest’ in physical gold, you constantly have to understand what is happening in the physical AND paper market. It helps to study central bank buying of gold, physical supply, how it is used as a safe haven against bad governments, etc.
However, I also trade gold using intraday price action strategies, and sometimes my methods/opinions on one get mixed with another. Long term I am a bull on gold, and have been since 2004/05 back at the $400 levels.
Many times in the last 3 months, I was long paper gold. Yet intraday price action would be screaming for me to get short. My broker allows hedging – so why wasn’t I shorting physical? Because my long term investing bias was interfering with my short term trading methods.
One of my top trading mistakes for 2012 was forgetting that I am a trader first and foremost, and to not let my bullish bias or investing strategies interfere with an obvious price action setup.
A good example is I bought paper gold at $1633, which I blogged about as a high probability breakout. At one point I was up 51x my risk, meaning for the 300 pips I was risking, I was up about 15200 pips.
By the time I walked away from the trade, I was only up 6500 pips. I didn’t follow exit rules because of my long term investment bias.
Remember, a trader and investor are two different things, and you must understand the difference.
2) Trading Against Impulsive Price Action
One of the base models I use for trading is understanding impulsive and corrective price action.
To sum it up briefly, impulsive price action moves are when the institutional market is heavily buying or selling and driving the price action directionally. With training and practice, you can learn to read the order flow behind price action, particularly by identifying these impulsive price action moves.
A few times this year I traded completely against these moves. Case in point – meet exhibit A, ironically on……wait for it……Gold!
Gold 4hr Charts

Looking at the chart above, you will notice on the bottom left points A and B which showed strong price action rejections. Buyers stepped in at this level, driving prices almost $50 higher in about 6 days.
At C you will notice the pin bar at C which was the second sign the bullish move was ending. Any idea what the first was?
Regardless, after the pin bar, price action failed to make a HH (higher high) and started with selling off impulsively at D, then more sellers came in at E, and by F, once it broke the role reversal level, price got monkey-hammered dropping $30 in 4 hours.
I had a buy order at the support level at G, so made some profit on the bounce, but missed the fact the market was still showing impulsive price action selling.
So at H what did I do? I bought some again, hoping for a similar move. The result is below, but you get the idea.
Gold 4hr Chart Exhibit B

At the support level where my first long worked out, I went long again at H and the same level. Shortly after I was stopped out.
Instead of realizing I was trading against the trend and impulsive price action, I was looking for a reversal. I consequently missed the obvious breakout pullback setup at the same level I was looking to get long, which then became a role reversal level. This is what happens when you trade against the trend and your system.
Not only do you miss several good with trend setups, but after you get stopped out, you usually miss the follow up trade from your price action system to take advantage of the move.
3) Let Your Trade Run Until Your System Tells You To Exit
Barring any extreme or black swan event, I usually just let my trade run until my rule based system tells me to exit.
However on a recent buy on the GBPJPY, after getting a great entry and banking about +300 pips, I exited the trade, even though my system was still telling me to hold long and hadn’t given an exit signal.
Looking at the chart below, you can see on the top left at B a critical resistance level which started the massive 300 pip sell off.

Price started to show signs of exhaustion, and started a reversal. My ichimoku strategy picked up a buy order just above 126.60. Shortly after, price climbed rapidly gunning it for the same resistance level at 129.50. After the weekend gap rejected, I took profit banking about +300 pips.
Not so bad you say…until you look at the chart below.

Not only did my system hold on for another + 300 pips, but it gave me a re-buy signal around 132 and is still currently long today. I missed that one as well from being ‘upset’ about exiting early. Needless to say this would have over tripled my profits. Even though my system never gave me an exit, I got out of the position.
Not letting runners run is one of the most costly mistakes a trader can make. Yes, it is important to understand what is a high quality signal, but I’m guessing if you let just 10 of your trades run until the system gave you an exit, you would have made almost double your profits on those 10 trades. For me, it was actually 2.4x more. Food for thought.
In Closing
Part of trading is making mistakes, but a key component of your success is learning from your mistakes and making less of them over time. Regardless of your skill level or how long you have been trading, you will make mistakes. Anyone who only posts their successes and doesn’t admit to their failures is hiding behind a wall of fear and a false reality.
I make mistakes and I’ve been doing this for 12 years. But I learn from them continually and make less of them as time goes on. This translates into more profits, smaller drawdowns, less emotions, and a smoother equity curve.
Eliminating mistakes is the fastest path to making more profits. But the first step is becoming aware of them. This is where the trading journal comes in handy. If you’ve made 300 trades last year, are you really going to remember every mistake you ever made? Unlikely, this is why you have a journal, to help you become aware of your mistakes.
The second step is to actively work on eliminating and transforming them. If you repeat a mistake over and over again, then the cause is likely psychologically, and something that can be re-wired through ERT training and developing a successful trader mindset.
But the bottom line is you can transform your mistakes into strengths, and most definitely into greater profits. In almost all cases, making less mistakes can be the difference between a winning and losing day, month or year. And in almost all cases – will lead to significantly greater profits.
Kind Regards,
Chris Capre
I wanted to write a brief article on a simple method I use to analyze price action – that of drawing trend lines to read the forex price action angles, or the speed of the buying/selling in the market.
I’m going to use an example to highlight how they can be useful for understanding trends, transition phases in trends, and when to look for key price action reversals in the market.
Exhibit A: EUR/USD Daily Chart

Looking at the forex price action trading trendline chart above, the EURUSD started 2012 dipping to 1.2600 before starting an impulsive bull run which climbed almost 900+ pips in a month and a half. Now if you look towards the left side of the chart, you’ll see a pullback to the horizontal line. Price rejected off this line, forming a piercing pattern that climbed 6 out of 7 days and over 500+pips.
This is the move in line A.
After reaching the peak from move A at about 1.3500, price then sold back in 11 days back towards the same support line. Although the low from this sell-off was a tad higher, take a look at the bounce off the level.
Notice how it had 3 bear days in the 8 day move (2 more than in prior move), but only went about 400pips (20% less)?
To me, when I see two rejections off a key level, I’ll draw trend lines on both of them (underneath if they are bull moves, and above if they are bear moves). The reason I do this is to measure the strength or speed of the buying/selling. This is communicated to me by looking at the price action angle of each trend line.
In this case, I have a weakening angle from A-to-B. This communicates a weakening effort by the bulls and that the bears are trying to take control of the market. Keep in mind, this is all happening above a support level, so the bulls still have overall structural control.
When you however look at the last bounce off this noted support line, we can see a massive weakening in the angle. When I see three structural, or price action angles weakening successively, this usually is a sign of an impending breakdown. What is also interesting is the C leg took 12 candles to gain only 250pips (50% less than A-leg, and 38% less than the B-leg). Put these two together, and you should be looking for a breakout to the downside.
What is interesting is how price action formed a pin bar strategy off this key level. If you were just trading pin bars as is, without the ability to read price action in real time, you would have taken the long on this pin bar setup, but then got crushed on the ensuing breakout which is below.
Exhibit B: EUR/USD Price Action Angle Weakening/Trend Change

Working with this chart above, we can see how even though there was a pin bar setup at the horizontal support level, price dropped right through that – stopping out traditional pin bar traders who were not reading the price action in real time, or the change in the angles.
In a flash, the trend was reversed and the pair sold off over 600+pips in less than a month. Had you been reading the price action angles in real time, you would have spotted this potential trend change, and looked to get short instead of longing off the pin bar setup.
This is one way to use forex price action angles to help with your reading and understanding price action.
Another way you can use them is in understanding parabolic or climactic price action moves. These can also be understood via these trend lines and angles. But they are a simple tool which is highly useful in forex trend trading, understanding transition phases in trends, and when to look for possible reversals.
I hope you enjoyed this article and found it a useful addition to your price action trading toolbox.
For those wanting to learn to trade price action, get access to the traders forum, a lifetime membership with free updates and more, visit my forex price action course page.
Now that I have outlined the major components to Ichimoku Time Theory (ichimoku numbers), I want to talk about the 2nd pillar of Ichimok which is the Wave Theory.
Remember, the main pillars of Ichimoku are not the Tenkan, Kijun, Chikou and Kumo. These are components of Ichimoku to help you read the main aspects of what is going on with the trend, support and resistance, and price action – all within a glance.
But…..these are NOT the pillars of Ichimoku. This led Hosada to state the following when he realized everyone was getting stuck believing the Tenkan, Kijun, Chikou and Kumo were all Ichimoku was about;
“Of the 10,000 or so people who are practicing and trading ichimoku, only about 10 really understand it.”
The 3 main pillars of Ichimoku are;
1) Ichimoku Time Theory
2) Ichimoku Wave Theory
3) Ichimoku Price Theory
I have discussed Ichimoku time theory which is the basis for all the other pillars and all of the ichimoku components you use when you look at any ichimoku chart. Now I would like to get into the 2nd pillar which is Ichimoku Wave Theory. I will get into the basic components or waves only as there are several types of waves (basic, mid-term, etc.) so to give an introduction without confusing anyone, I will write about the basic waves in today’s article.
3 Basic Waves
There are 3 basic waves which are the most important ones to learn because they are the basis of the ichimoku wave theory and will always be a part of your wave counts. They are;
1) I Wave
2) V Wave
3) N Wave
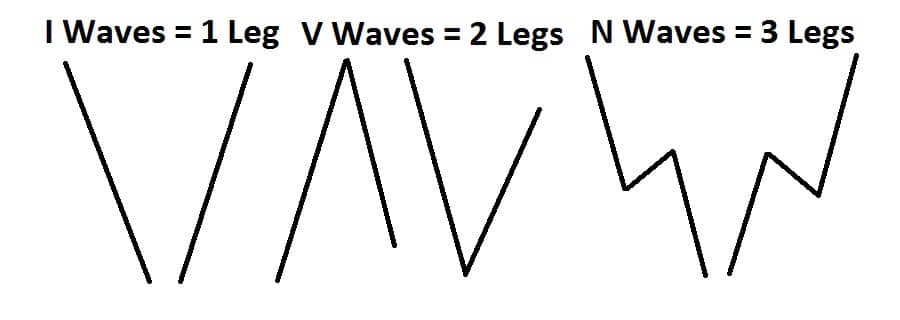
Ironically, an I Wave is 1 leg, a V Wave is 2 legs and a N Wave is 3 legs. Just like all the basic ichimoku numbers are building blocks for all the other numbers, it is the same with the waves. But let me show you a picture below to help give you a needed visual.

Looking at the image above, you can see how the one, two and three legs form the individual waves. I, V and N waves can all be up or down so that does not matter. Generally, I waves are impulsive price action moves, but they can be corrective. V waves are usually one impulsive and one corrective move, but can be two impulsive moves back to back. Whereas an N wave is usually an impulsive leg, followed by a corrective leg, and then another impulsive leg in the same direction as the original leg.
Being the most complex of the three, the N wave can have variations of this, but the first leg of the N wave should be impulsive with the other two having variations between them. Generally, most N waves will end with a higher high for an up wave, and a lower low on a down wave.
So the wave should end up lower or higher than where it started. If this is not the case, then it usually means a breakdown of the wave structure, but lets look at a few examples.

Using the chart above, I have labeled several lines, all of which individually are I Waves. As I said before, they all are components of each other, so a V Wave is really two I Waves put together, while an N Wave is either three I Waves, or one V Wave and one I Wave. But lets break this down in the chart above.
Starting at the top left of the chart, the first movement from A-B is an I Wave. Now by that token, the move from A-B-C is a downward V Wave. A-B-C-D would be therefore an N Wave, but also composed of two V waves (one up and one down). As a general rule, it’s better to look at the wave structure from a macro perspective then a micro one, so breaking say four N Waves up into 16 I waves is unnecessary. Look for the larger macro structure (gestalt) of the wave structure and you got the trick.
Now, as I stated, even though A-B-C-D is an N Wave, it doesn’t end with D being higher than B. When this happens, it generally means a range bound market at a minimum or a breakdown into a downward N wave, but rarely ever do these end up with higher prices above B, especially if C is breached.
Since this did happen, we actually have an downward N Wave starting at B-C-D-E. We can also count a downward N Wave from D-E-F-G. This brings me to the point that N Waves generally continue in their original direction until the ideal structure of the waves gets broken or disrupted. It also means N Waves can continue and parts or legs (ends) of them can start new N Waves in the same direction.
So if we were counting a new N Wave from F-G-H-I, since the wave structure is being disrupted, we would expect a likely reversal, and this is supported by the upward N Wave starting at G-H-I-K. This may seem like a lot, but this should give you some starting ideas of how to use these basic waves when reading an ichimoku cloud chart and will get easier with practice.
Usage in Trading
There are many ichimoku trading strategies we can use with these basic waves in trading, and if you were paying attention, I already gave away one idea. One example is how the wave structure generally performs (particularly N Waves). If the structure breaks down from its ideal formation, then watch for trend change – minimally a consolidation, but definitely not a trend continuation.
Another way this can be useful is if the number count (using ichimoku numbers) in a particular move is getting long, such as a two section, one period or a combined-6 move. These common turning points, combined with wave structure changes often bring a confluence of signals together which can mark major turning points in a move.
For example, in the chart above, the move from D-G is actually 1 day short of a one period move (a common turning point).
Additionally, you can combine forex price action strategies with these moves, especially reversal setups, so when you see (for example) pin bar setup happening at a major resistance, along with an N Wave structural change, this can increase the probability of a reversal.
Other ways to do this is if the V Wave is not a traditional impulsive move followed by a corrective move. For example, if it is an impulsive move followed by another one counter-direction, this could also be suggesting trend change or a range bound market, depending upon how it started the V Wave.
As you can see, there are many ways, too many to discuss here, but hopefully this gives you something to work with.
In Summary
Although there are other waves that we have not discussed, this is a good introduction and start to understanding Ichimoku Wave Theory and gives you the foundational theory to start practicing with the basic waves. But it is important to understand this is one of the key pillars underlying all of Ichimoku Kinko Hyo theory, so understanding the basic waves is a gate towards understanding ichimoku trading strategy as a whole.
Best is to practice forex wave theory by itself so you learn it as an individual component. Then after building some experience, combining it with ichimoku time theory. But hopefully for now, this gives you a nice introduction to Ichimoku Wave Theory as there is very little information about it available, nor discussed openly.
For those wanting to learn how to trade the Ichimoku Cloud, time, wave and price theory, along with lifetime access to the Ichimoku traders forum, discussing ichimoku setups using rule-based systems, make sure to visit my Advanced Ichimoku Course.
If I had to follow only one simple rule of price action, it would be to understand impulsive and corrective price action, and if I could only trade one type of move, it would be impulsive moves hands down. They offer the most profit potential, communicate where the institutional players are buying and selling, whether they are buying or selling, and what the dominant trend is.
This is not to say one cannot make money trading counter-trend, but that far more money and profit will be had trading with the trend, but to be more specific – trading impulsive moves.
The Base of the Pyramid
If I had to look at price action as a structure, it would be a pyramid, with the base being how price action is a reflection of order flow (particularly executed transactions). The next part (or level above) from that base would be understanding price action through the lens of impulsive vs. corrective moves.
I will briefly describe what impulsive and corrective moves are, giving the key characteristics of each type of move. Then I will discuss what they generally communicate from an order flow perspective. After this I will talk about what is the general pattern they will form, and how you can use this for trading impulsive moves.
What Is An Impulsive Move?
An impulsive move is one whereby the market moves quite strongly or heavily in on direction, covering a great distance in a short period of time. These moves tell you when the imbalance between the buyers and sellers is really strong and there is heavy participation from the institutional side.
Logically, more money can be made during these impulsive moves, as they cover more points or pips in less time. They are generally more volatile, and thus provide us with great opportunities to get more R (reward) with less risk since the market will stretch more easily in one direction. But no matter what, we want to be trading with these moves as much as possible, not against them.
Three Characteristics
Impulsive moves tend to have three characteristics common among all of them. These three can help clue you in to when an impulsive move is starting, or in play. They are;
- Large Candles (bodies)
- Mostly of one color (blue/bullish, or red/bearish)
- Closes towards highs/lows of the move
Let’s examine all three points.
1) Large Candles communicate to us there is strong participation and order flow behind this particular candle. Strong imbalances during a candle will translate into larger candles than the norm. When you see large candles forming consistently in one direction, they indicate strong order flow behind them from the institutional side. Since the larger players are behind them, they give us a clue of the direction we want to take, essentially surfing the waves they (institutional) are creating. Take a look at an example below.
Notice how in this chart, the candles that stand out the most are the red ones, particularly the ones towards the top left? They are the largest in this entire series, communicating strong order flow behind them.
In fact, if you look at candles 1-8, all but the blue doji in the middle are solid in size. Yet candles 9-17 are all contained within the highs and the lows of last 2-3 candles in this down leg, communicating weak order flow and participation behind them.
As a whole, impulsive moves tend to have large candles (bodies and wicks) behind them.
2) Mostly of One Color – this ingredient is also common among impulsive moves as it communicates something critical to us – time. More specifically, how the bulls or bears were able to maintain control of the price action over time.
In the chart above from image 1.1, you will notice in the down leg, there is only 1 blue candle, meaning for 8 out of 9hrs, the bears had complete control of the market (almost one full trading session).
By maintaining control over time, the market is communicating who is the more dominant side because they are not allowing the other to take control of a candle for that time period. The greater the imbalance is between the bulls and bears over time, the greater the dominance is from either the bull or bear side of the market.
It is important to look at price action not just based on structure of the candles, which is one dimensional. Price doesn’t just move in a vacuum, it moves in time, and HOW price moves over time can communicate a lot of information to us as traders.
3) Closes Towards the Highs/Lows of the Move – If you think about it, when the market is in a strong trending move, let’s say using a 4hr chart, and the candle that closed in the direction of the trend (in this case uptrend) has a very small wick, thus a strong close towards the highs, what does that communicate?
It should communicate that there is very little profit taking from the players behind that candle. If they were worried going into the close of that candle about an upcoming resistance level holding, or perhaps the bears may take control of the market, they would likely close their position, or take profits right before the candle closed.
But when you have a strong close with a very small wick, this usually indicates very little profit taking, thus a confidence the move will likely continue. This is highly useful to us as traders, and will be common among impulsive moves like in the chart below.
Image 1.2 GBPUSD 4hr Chart

Starting with the top left of the chart using candles 1-4, the price action moves in a sideways corrective fashion until candle 5, which if you notice, increases in size tremendously (rule #1 of impulsive moves). From here, price continues on selling for the next 9 candles, 10 total in a row, or 40hrs of selling (rule #2 of impulsive moves).
But looking at the candle closes, you can see most of them are towards the lows, showing very little profit taking along the way, thus suggesting likely continuation.
Only until candle 11 do we get a strong rejection, and from here price then moves sideways in a corrective fashion until candle 16. But what happens at candle 17? The candle expands (rule #1) telling us the trend will likely continue.
So these are three examples of the common characteristics of impulsive price action moves.
What About Corrective Moves?
The good thing about corrective moves is they are easy to spot, since they have the inverse characteristics of impulsive moves. Meaning, they tend to have;
- Smaller Candles
- Greater mix between red/blue or bull/bear candles
- Closes more towards the middle with larger wicks
Thus, if you apply the logic of impulsive moves, you can easily understand and identify corrective moves.
How Do They Relate to Each Other?
Generally, impulsive and corrective moves tend to have a common pattern or dance with each other. The general pattern that tends to play out between them is the following;
1) Impulsive moves about 75% of the time are followed by corrective moves. These corrective moves can either be horizontal, slightly against the impulsive move, or even slightly in the same direction, but they denote a change in the order flow and participation.
2) 75% of the time, these corrective moves are followed by impulsive moves in the same direction as the original impulsive move. Why?
Because those who are in control, rarely give up control unless encountering a strong counter-trend force. Even then, they usually make a second attempt to take out a recent swing high or low before giving up.
Only when they fail a second time will they usually exit the market, either waiting for a new chance to get in on a pullback, or reset completely. This is why V-Bottoms are quite rare and only form about 10% of the time. Usually there is a 2nd bottom, which is could be a LL (lower low), HL (higher low) or a similar low.
3) This series between the impulsive vs. corrective moves will generally continue until the market encounters a counter-trend impulsive move, which usually translates to an equal or greater force on the opposing side of the market. Very similar to Newton’s Laws of Motion about an object in motion will stay in motion until acted upon another object with equal or greater force.
Let’s look at an example below.
Glancing at the chart above starting with the bottom left at move A, you can see how it was an impulsive move, followed by a corrective move (B). This series continued until…it hit a counter-trend impulsive move in G. It was only until here did the bulls finally relent control as the opposing bears took control of the price action with the bulls likely taking profit or exiting all together, especially after the low point from move D was taken out. Ironically, what followed move G, was a corrective move after, followed by the bears continuing the down-leg.
An Example Trading Impulsive Moves
Today gave a really good example trading an impulsive move. Gold was a perfect example of a textbook impulsive-corrective series, offering a great setup to go short for a large reward to risk play.
Take a look at the chart below which is the 1hr chart on Gold. Starting with the top left of the chart, we can see a consolidation over line A which is a corrective move. Then at candle 1, we have more selling in one hour than total buying for the last seven, which starts an impulsive leg down at B, selling off about $25 in 10hrs.
At candle 2, we see a corrective move (C) whereby price climbs about $8 in 12hrs, so less than 1/3 the climb from move B which took more time. This is a clear example of how its less profitable to trade counter-trend than with trend. This is not to say we cannot trade counter-trend, but there is far less money to be made.
The corrective move at C ends with a pin bar rejection just $.50 below the 20ema, then starts another impulsive leg down at 4, dropping over $18 in 3hrs, also ending with a large pin bar. I actually bought off the lows and made a quick profit, but there was far more profit to be made in less time selling from 3 or 4, then buying off of 5.
In terms of knowing whether to buy or sell, if you can learn to find an impulsive move, followed by a weak corrective move, often times that corrective move will offer a pullback setup into the 20ema or a prior support/resistance level. These offer high probability low risk high reward setups. Anyone selling the pin bar rejection at 3, or the pullback into the 20ema at 4, with a tight stop above the 20ema, targeting either the low at 2, or waiting for the pin bar close at 5 would have made anywhere from a 3:1 reward to risk, up to 12:1 reward to risk.
These opportunities show up in the market all the time, and if you can learn to read them, you can make a considerable profit by trading with the institutions impulsive buying or selling. This is why it is critical to learn to read these moves, as they will help you not only trade in the right direction, but find highly profitable setups.
In Summary
This is just an introduction to how I approach price action and how I use this model as a base for understanding price action. When you can learn to read impulsive and corrective moves, you will find they are highly effective for many things, such as;
- finding the right direction
- staying in the trend
- spotting great pullback opportunities to get back in with trend
- knowing when the market will continue and when the market is likely to reverse
- how to find some of the more profitable moves in the market (impulsive)
- knowing who is in control of the market
and more…
There are many other facets and subtleties to trading impulsive and corrective price action, but this is a good introduction to my base theory and model for trading price action. If you can learn to spot the impulsive and corrective moves in the market, they can greatly enhance the odds of your trades along with helping you spot key characteristics in the markets.
To learn more about trading impulsive and corrective price action, visit the Trading Masterclass.
Today I am going to give a lesson on how to find some of the best support and resistance levels in the market. If I had to say – I think there are three types which are the best support and resistance levels you could find. But it would take a long time to go into each type, what are the characteristics of each, what they mean from an order flow perspective, and how to trade each type.
So I am going to cover in today’s lesson, what are some of the most critical variables to look for when evaluating support and resistance levels. If you can learn to spot these levels, read the price action and key variables before the market reaches these levels, you will greatly enhance your trading, by finding better entries, knowing how the market is likely to react off a level, and how to increase the probability of your trades.
By first learning to read these key variables which I will list below, they will provide you with a lot of information in terms of;
-how the order flow is relating to them
-how these levels will improve the probability your trade or rule based price action system
-how you can trade these key levels
Note: I want to hear your feedback on this lesson, like what key points stood out for you, what you found useful, how you can apply this to your trading, or…even if you want to throw tomatoes at me, I want to hear your comments 🙂
I will start this lesson by talking about what are some key things to look for when evaluating support and resistance levels. I will then describe with some details how each variable informs you of the order flow behind the price action. Then I will go over some basic methods of how you can trade them. I will also give examples to demonstrate how these elements work, then end with a brief overview of what we covered.
Key Things To Evaluate Support and Resistance Levels
If I had to list what are the key things I use to evaluate support and resistance levels, it would be the following;
1) How price reacted to this level in the past (held, became a breakout – pullback level, bounced violently or timidly off of it)
2) How significant is it (lower time frame, higher time frame, held for how long?)
3) How is price reacting or responding to it now
4) What is the speed or impulsiveness price is approaching it now
5) What is the price action context prior to this level
All of these things communicate information to me about the uniqueness of this level, how the buyers/sellers reacted towards this level in the past, how likely they will respond to it in the future, and what they are most likely to do at this level.
Zones & Areas
It should be noted that I do not consider support and resistance levels to be lines in the sand, but more of a ‘zone‘ or ‘area‘. That means I do not consider a resistance level to be one price, but likely several pips on either side. This could be due to differences in price feed, server time, what other traders think of that level, and how they would play it.
A scalper will more likely get as tight to the level as possible, but scalping orders rarely are large in volume or market movers. However, a swing trader or large institution will likely be getting in at several levels, and the level you might be spotting may be one of them they are placing a large order at.
Because of this and all the different ways institutional players relate to these levels, support and resistance levels for me are zones or areas which could be anywhere from a few pips wide to 10+, maybe more depending upon the time frame the level relates to.
Obviously a level from a weekly time frame over years would have a little more play then an intraday level on the 1hr chart so take this into consideration.
What Each Variable Communicates
Although I could spend an entire treatise writing about all the things each variable above communicates, I will go over the key points here.
1) How Price Reacted To This Level In The Past – this is a big one as it tells me what the major players thought of this level. Was the pair highly over/under valued here and it produced a violent reaction in the past? If so, then the first time it comes back to this level, we can expect a strong reaction. Why?
If the reaction off a level was fast, that translates into heavy buying/selling with some large player initiating the rejection. This is followed by other players quickly rushing in to get as close to that price as possible, essentially chasing for the best price, but agreeing with the initial rejection. These levels are defended with a lot of money, and if price does not come back for some time because it traveled fast and furious off this level, then the next time it gets there (especially if it’s the first time back), expect a strong reaction.
When gold sold off massively due to huge margin increases by the metals exchanges, it crumbled hard and everyone was wondering where the bottom was. It found it eventually at $1532 where in one day, it opened at $1640, jumped up $23, dropped $130, then bounced $96 from the lows which was quite an amazing rejection inside one day. This is a violent reaction, so traders were definitely taking notice of it the next time it approached this level. Can you guess what happened when it got there again?
As you can see, price held this level with a tiny breach, then bounced the next 4 days in a row, suggesting strong follow up buying on this rejection. The first time back usually is a slightly lesser bounce since many know of the level, and thus less traders are trapped (or surprised) from a violent rejection the first time around. But usually, this level will hold.
Remember, this is one scenario of how price has related to it in the past. All the other types of reactions communicate a different story.
2) How Significant Is It (lower time frame, higher time frame, etc) – this really has to do with time as all support and resistance levels have what I call a ‘time degradation‘ to them. Simply put, traders have a memory, but they are more inclined to take recent information as more valuable then information a while ago, especially if they are short term traders. Generally, higher time frame levels will dominate and last longer than lower time frame levels. Also, when possible, I’m more interested in drawing levels that are more likely to maintain the trend as that is the more probable scenario. I particularly relate to these when reading the impulsive vs. corrective moves in the market.
For more information about understanding impulsive vs. corrective moves, make sure to watch the video here.
But once you have established the trend according to the impulsive vs. corrective series, look for breakout pullback level where the trend continued, or major swing highs/lows where the trend paused and pulled back to. These will often present great opportunities to get in with trend.
3) How Price is Reacting To It Now – Is price closing on a support level, and just sitting there, with smaller and smaller bounces off it? If so, a breakout through the level is more likely as there is no strong buyers able to push back, and the sellers continue to squeeze them out of the market. Was there a strong pin bar reversal off this level? If so, it could be telling you it will likely hold on a second attempt and start a reversal, hence look for an entry close to the level. How price reacts to the level in the moment can tell you if it’s likely to hold or not, but this analysis should be done before it reaches the level.
Often times the market will demonstrate a price action reversal signal at these levels. Keep in mind, this is the ‘effect‘ of how players responded to the level, not the cause. Order flow was the initial cause, and the level was the location. Everything else was a response to the initial reaction off this level. Hence these price action triggers are often ‘secondary entries’ (or sub-optimal) regarding the level. Sometimes a price action trigger, say a pin bar on a 4hr chart can be an engulfing or piercing bar on a 1hr chart. So sometimes it helps to look at a lower time frame to see what the more micro responses off this level are, or what the price action context was leading up to it.
But no matter what, there will always be clues as to what the major players are doing at this level, and what the more likely scenario is. Look for impulsiveness (strength) off the level, or weakness (corrective price action) off this level for initial clues.
4) What Is The Speed Or Impulsiveness Price Is Approaching The Level – this will really tell you a great deal of information whether a level is likely to hold or not. If you are trading with trend, and with the move when it is approaching a level, how strong the move is heading into it, and what is the underlying characteristics behind the price action (speed, acceleration, etc), will tell you what is more probable.
If a level is an intraday level, or one from only a day ago, a really impulsive move is likely to break through it. If it’s a daily low or high, or a level that held for a week or longer, it will have a better chance of holding. Think of it like a moving object. Consider the size of the object in relationship to what the obstacle in its way is. Normally, force x acceleration (& mass) will tell us whether the obstacle ahead will cave or not. Unfortunately, we do not have exact information about the orders at a level, such as the number and size of them which would equate to mass and volume of the object. Level 2 quotes would help in this fashion, but if you don’t have that, then what?
Why not use the other principles above, such as;
-how did price react there in the past
-how significant is it
-how is price reacting to it on first touch
Weigh those against the force, or impulsiveness of the move, and you’ll be able to get a better idea.
A good example would be the following chart below of the AUD/USD on the daily time frame

Price approaches the level with some volatility, as there are solid moves on both sides of the fence with bears maintaining control on the way down. Price bounces off the level with a piercing pattern and then a second attempt forming a pin bar reversal. But then after a small retrace, price attacks the level with vigor, selling off 4 days in a row, taking out the last 13 days gains. Does this resonate strength to you? Do you think it will break? See the chart below
As you can see, price was exhibiting a lot of strength and impulsiveness heading into the support level. There were definitely some clues ahead of time this was going to break. Such as how price barely lifted off the level each time, and attacked it twice without ever gaining much ground to the upside.
Keep in mind, the trend was already down leading up to it, so with trend traders used these pullbacks to get back in the trend. The last time they said enough is enough, and went to take out the barriers at this level. The buyers at the support level likely exhausted themselves on the first two rejections which failed to gain traction.
Putting all these components together would have communicated a breakout was likely, which would have helped your current short, or give you a second opportunity to get back in on a textbook breakout pullback setup for a high probability-low risk trade.
In Summary
So there you have a few key variables to look for in finding the best support and resistance levels. Remember, price action patterns form at these levels and are the ‘effect‘, not the cause of the move. They do communicate information to us as traders, what we are looking for is the price action context before we reach these key support and resistance levels. Hence, it is these key levels where orders are being placed first.
Thus, by learning how to read the price action and the key variables I listed above, you can greatly improve your ability to spot good setups, improve your entries, placing trades where weak players are getting in, and the stronger players are looking to enter.
Please make sure to comment below, and click on the like buttons to share this article 🙂
For those wanting to learn to trade price action, get access to the traders forum, lifetime membership & more, visit my price action course page here.