Tag Archive for: breakout pullback setup

What’s Inside Today’s Trading Article?

  • Let’s talk about breakout strategies
  • What are some consistent breakout patterns?
  • When trading breakout patterns, how can I avoid false breaks?

Ever heard the statements “most breakouts fail” or “you should avoid trading breakouts“?

Let me just put the kibosh on that by sharing with you Exhibit A.

Behold…Exhibit A – winner of the 2017 World Cup Futures Championship, Stefano Serafini, who won with an impressive +217% return (see below).

stefano serafini breakout trader 2ndskiesforex

What was Stefano Serafini’s main trading strategy to generate such an impressive return? Trading intra-day breakouts!

So do me a favor, the next time you see some fake trading guru telling you “most breakouts fail” or “you should avoid trading breakouts“, please share the link to this post.

For today’s article, I’m going to share with you two breakout strategies to help increase your accuracy & profitability in trading breakouts. I’m also going to share how you can use this to avoid any false breaks and getting stopped out.

Let’s jump in.

Breakout Strategies

While there are many types of breakout strategies you can classify breakout trades into two broad categories:

  1. The momentum breakout setup
  2. The breakout pullback setup

For today’s breakout trade article, we’re going to focus on the second breakout strategy (breakout pullback setup) as it’s much easier for traders to learn and execute because it requires less skill.

NOTE: If you want to learn how to trade momentum breakout setups, then check out my Trading Masterclass course where I teach you how to trade this for maximum profit.

The Breakout Pullback Setup

Before you can even make a breakout pullback setup, you’ll need to identify some of the consistent breakout patterns that manifest in the price action.

By learning these, you’ll be able to identify A+ setups which will increase your accuracy and profitability in trading them.

There are many things you can do to identify an A+ breakout pullback setup, but there are 2 things I’ll give you to work with for now.

Breakout Pattern #1 – Finding a key support or resistance level with a minimum of two touches

Why two touches?

While the market may hit a key support or resistance level once, which indicates at least some potential order flow and institutional players wanting to hold that level, two touches indicates a greater probability and amount of order flow behind that level.

trading forex breakouts 2 touches 2ndskiesforex

The more buyers/sellers you have at that level, the greater the chance the breakout trade will succeed.

Why?

One reason is those same players who, when they get stopped out after their support or resistance level is broken, them getting stopped out clears out some of the order flow against that breakout, thus making it easier for the breakout to continue.

On top of this, smart money players after they’ve been taken out (and spot a good breakout) will often flip sides after they get stopped out, thus providing further momentum to your breakout trade.

Hence it’s important to identify a level that has a minimum of two touches (the more, then better) to increase your probability of a breakout setup forming.

Breakout Pattern #2 – A reduction in the reactions (or pullbacks from that support/resistance level)

Why does a reduction in the pullback from a key support or resistance level help your breakout trades?

Let’s say the market is in a bull trend and it’s encountering a resistance level where there are likely bears with offers up at that level. If the bulls hit the resistance level the first time, and the market pulls back say 50 pips, then when the 2nd time the price action hits that resistance level, the market only pulls back say 25 pips, this indicates a weaker reaction by the bears at the level.

A weaker pullback from the bears = less order flow and strength on their side. As their side continues to weaken, this a) gives the bulls more confidence a breakout is becoming more likely, and b) communicates their side is losing the battle.

Looking at our prior chart, notice how the reactions/pullbacks to the resistance level were weaker the 2nd time around?

trading forex breakouts two touches 2ndskiesforex

Those weaker reactions were communicating how the bears were less able to push back while the bulls kept their foot on the gas, producing an eventual breakout.

Below is another good example of the two touches + weaker reactions to the resistance level on the USDJPY, producing a +125 pip breakout.

forex breakout setups 2ndskiesforex

Hence, make sure to look for weaker reactions each time off a key support or resistance level to identify a high probability breakout.

Key Tip: One additional pattern you can apply in the price action is to look for breakout setups that are forming with trend vs counter trend.

Now that I’ve shown you two underlying components of a breakout strategy, let’s talk about how you can get in on a breakout pullback setup.

The Breakout Pullback Setup

Assuming you’ve found a situation whereby you have the minimum two touches off a key support or resistance level, along with weaker reactions to the level each time, let’s talk about how you can get into a breakout pullback setup and how I trade it.

Once the market and price action has closed above your key support or resistance level, I’ll place a limit order on that particular support or resistance level to trade in the direction of the breakout.

NOTE: I am not waiting for a confirmation price action signal to form on that level. If you’ve read the price action context correctly, and found a legitimate breakout, any confirmation price action signal will only give you a weaker entry, and thus reduce your profitability.

If you learn to read the price action correctly, you won’t need any confirmation price action signal to get in the market, because the underlying order flow from the big players will already be there.

When I’m trading a breakout pullback setup, once I’ve qualified the breakout, I’m placing my order to get long/short on a pullback to the level.

If the order flow at that level is legit, there will be larger players willing to get long/short at that level without the need for any pin bar, inside bar or ridiculous tailed bar.

Case in point, watch this video on me doing a live breakout pullback trade on the NZDUSD for +100 pips of profit with only a 29 pip stop loss.

Notice how there were two touches on the support level near 6625, along with each bounce getting weaker. Once the market broke through the level, I placed my order to get short.

After pulling back to my level, and barely going negative, the pair took off for over +100 pips of profit.

Had you waited for any confirmation price action pin bar signal, you would have a) gotten a worse entry, and b) had less profit potential.

You can see another example of a live trade using a pyramiding trading strategy where I get in on the breakout pullback setup to the level on both trades, stacking onto the same with trend move for extra profit.

After watching the two videos, hopefully these examples give you a good idea of how to trade the breakout pullback setup.

How to Avoid False Breaks?

There is a lot that can be said about avoiding false breaks when trading the breakout pullback setup, and there are many breakout patterns that often fail.

false breakout patterns

To keep it simple, the best thing you can do is:

a) learn to read price action context, and

b) trade with trend as much as possible

By learning to read price action context, you’ll have a better grasp at finding key support and resistance levels where there is a lot of order flow around that level. You’ll also be better able to spot with trend environments, which are much more favorable for breakout trade setups. This is because there is a greater amount of order flow in your favor to support your trade.

In Summary

To recap, trading forex breakout patterns can be a highly profitable trading strategy when you learn to identify A+ breakout setups. There are two classifications of breakouts, which are a) the momentum breakout setup, and b) the breakout pullback setup.

There are also key breakout patterns you can spot in the price action which will help you find higher probability breakout trades.

In the beginning, try to trade breakout pullback setups as they require less skills, and will help you build your confidence in trading breakouts over time.

Lastly, when trading the breakout pullback setup, make sure NOT to wait for confirmation price action signals as they’ll give you a worse entry (trade location) and reduce your profitability.

Now Your Turn

What did you learn from this article that helped you with trading breakouts in the forex market (or any market for that matter)?

Did you find this useful and give you some increased confidence to trade breakouts?

Are you currently trading breakouts and struggling?

Please make sure to leave your feedback and comments to help us create better trading articles and content for you.

Until then, may good trading setups and karma be with you.

Kind Regards,
Chris Capre

What’s Inside?

  • Can I trade set and forget with a full time job?
  • What are some set and forget trading strategies you can use?
  • What skills do you need to trade set and forget in the forex market?

In my last article, I showed how you can do forex day trading.

This week I’ll be covering how you can do set and forget trading in forex, stocks, commodities, and global indices.

The basic definition I’m working with when I’m talking about ‘set and forget trading‘ is whereby you open a position with a pre-defined stop loss, take profit and entry location, and once the trade is activated, you let it go with no trade management.

This means you let the trade run until it hits your take profit, or your stop loss. Hence the name ‘set and forget‘.

set-and-forget-trading-ichimoku-2ndskiesforex

This can be done on any time frame, meaning you can do set and forget trading on the weekly time frame, the daily or 4hr charts, or even the intraday charts such as the 1hr and below.

Yes, you can even day trade using set and forget, meaning you take a trade for the day and close it when it hits your SL, TP or the daily session is done.

The key point is once your trade is active, you do not manage the trade.

Now let’s get into some of the key points and topics you’ll need to know around set and forget trading.

Can You Trade Set And Forget With A Full Time Job?

Short answer? Yes, and something you should (most likely) use if you have a full time job and only 1-2 hours per day to trade the forex markets (or any markets for that matter).

set-and-forget-trading-with-full-time-job

The opposite to set and forget trading is to actively manage your trades. I wouldn’t recommend this if you lack any of the following:

  1. Really solid price action skills to be able to read the price action context in real time, and thus be able to manage your trade to get the optimal profit out of it.
  2. Have a baseline profitable track record showing you can manage your trades
  3. Have the time to consistently watch your positions
  4. Have pre-defined conditions/rules/patterns to help you exit your positions early

Hence, if you lack any of the following above, then you should be trading set and forget.

Additionally, if you’re just starting out in the markets, I’d also recommend trading set and forget to build a baseline showing you can find trades, entries, and have well placed stop losses and take profit levels.

Now that we’ve established who should be trading set and forget, let’s get into my suggested rules, tips and strategies.

Trading Set and Forget Tip: Have A Pre-Trade Routine

Trading takes a very particular mindset and mental activity to do it profitably. Very rarely will your work mindset perfectly lead you into the right trading mindset.

Because of this, I recommend having a pre-trade routine, whereby before you even start trading, that you sit down at your computer and clear your mind, making sure you’re relaxed, clear and focused before you make any trading decisions.

relaxing before trading

All you need is about 5-10 minutes of mental preparation to get yourself into a clear state for trading.

NOTE: If you want a simple 5-10 minute practice to get ready for trading, read my article on meditation for trading.

Once you are mentally settled and ready to trade, then you’ll want to load up your trading platform and begin your pre-trade analysis.

For your pre-trade analysis, you’ll also want a routine that is structured and fixed. What I mean by this is:

  1. You trade ideally at the same times per day
  2. You only look at a fixed set of instruments every day that are a part of your trading plan
  3. You start with a top down analysis, meaning you start with the higher time frames, and work your way down (if you’re doing multiple time frame analysis)
  4. You begin by analyzing either the price action context first, or the Ichimoku context if you’re an Ichimoku trader

trading preparation at trading desk

Once you have the above completed, it’s time to select which trades meet your criteria, and then enter your entry location/price, your stop loss and take profit levels.

NOTE: You should always trade with a minimum of 1:1 risk to reward ratio (or better). If you want to learn more about why you need this minimum risk to reward ratio, click here.

As to choosing your risk to reward ratio, I don’t recommend it always be a fixed number, but it should always satisfy the minimum 1:1.

Targets should always be set based upon the price action context (or Ichimoku context). If you have a particular trading strategy that suggests a specific target, then fine, fire away. But you should always be targeting a take profit location you can hit with a profitable trading edge over time.

I don’t recommend any fixed targets until you have a sufficient baseline and data to clearly back up what your most optimal target is because you could be getting out too early just based on a fixed target.

set and forget trading 2ndskiesforex

If you are new to trading, then I’d suggest somewhere between 1.25R and 2R. ‘R‘ simply refers to your risk, so if you’re risking 100 pips, 1.25R would be 1.25 x 100 pips, so 125 pips.

As to position sizing, I’d recommend no more than 1% per trade, and if you’re a beginner, then better to be extra cautious and use .5% risk per trade as you’ll likely make more mistakes in the beginning, and thus will need an extra buffer to compensate.

NOTE: We always recommend risking a fixed % of your equity per trade. To learn more about why we recommend this, click here.

Trading Set & Forget Tip: What Instruments to Trade

The most important rules of thumb for choosing what instruments to trade are the following 3 points:

  1. Don’t trade more instruments that you can easily manage/follow/analyze
  2. Whatever instruments you choose, stick with them for a minimum of 3 months to build a proper baseline
  3. Ideally stay within the same asset class till you have stability and profitability with that asset class

If you’re looking to trade the forex market set and forget, I’d recommend a minimum of 4-5 forex pairs, with 2-3 of them being major pairs, ideally one minor pair and one exotic pair.

Also make sure to trade only forex pairs which are most correlated with your region and time of day.

So USD and European currencies if you are in the UK/Europe/North America.

For Asia/Australia/New Zealand, I’d suggest at least 2 currencies from your region (JPY, AUD, NZD, CNY, SGD, KRW) and minimally one USD pair.

blur 1853262 1920

If you’re looking to trade stocks set and forget, I’d recommend one or two indices from your region, and at least 2-4 consistently volatile stocks from your region. You can also look for an ETF or two as well.

If you’re looking to trade commodities set and forget, I’d recommend at least one energy/natural resource product, such as WTI/Nat Gas, one to two precious metals, such as gold/silver, one to two industrial metals, such as copper or aluminium, and one to two agricultural products (corn, wheat, sugar, etc).

Now that you have your pre-trade routine, position sizing and instruments all set, the next thing you’ll need to setup will be the time frames you trade with.

Trading Set And Forget Tip: Time Frames To Work With

For day trading set and forget (meaning you open/close your trade within one day or one trading session), I’d recommend using the 4hr or 1hr time frames for your higher time frame context, then trading on either the 15 min chart, 5 min chart or 3 min chart.

For swing trading set and forget (meaning you hold your positions for days to weeks, perhaps a couple months), I’d recommend using the daily time frame for establishing your higher time frame context, then either making your trading decisions on the daily chart, 4hr chart or 1hr chart.

trading time frames

As to which time frame to make your trading decisions on, a general rule of thumb is to:

a) choose the time frame which looks the cleanest for your trade setup, and

b) which is most relative to your target size and holding time.

In terms of which time frame is best based upon your target and holding time, first you need to establish what your target is.

A simple rule of thumb is to setup an ATR indicator (set to 5) on the daily chart to see what the average daily range is for your instrument.

If your target is outside the current ATR, then you’ll likely need multiple days to hit your target and should be working with a higher time frame. If your target is within your daily ATR, then you’ll want to be using a lower time frame chart.

eurusd-atr indicator 2ndskiesforex

Set And Forget Trading Strategies

Whether you’re looking to set and forget trade forex, stocks, commodities or global indices, one consistently strong setup and trading strategy is the breakout pullback setup.

This is a straightforward strategy where you’re looking to trade with trend, and are waiting for the market to break above/below a key support or resistance level (break resistance for bull trend, and break support for a bear trend).

breakout-pullback-setup-2ndskiesforex

Once the market breaks its key level, you’ll then wait for a pullback to the prior support or resistance level to trade in the direction of the trend.

I have a video on how I traded the breakout pullback setup for +110 points on the UK FTSE with my own money which you can watch here.

I also have another video on the breakout pullback setup for +100 pips on the NZDUSD within a matter of hours. You can watch that video here.

The breakout pullback setup is such a classic and useful strategy that when you trade it with the right price action context can be a very profitable setup so it’s definitely one you’ll want to practice and master.

In Summary

By now you should also be well aware of how to trade set and forget, starting with your pre-trade routine, what instruments to trade and how many, what % of your equity you should risk per trade, what time frames to trade, and what strategies to trade set and forget.

If you’d like to learn more advanced methods to trade set and forget, along with see more examples of me trading live with my own money, then make sure to check out my Trading Masterclass course, where you’ll get access to our members trade setup forum, market commentary 4x per week and ongoing training.

With that being said, please make sure to leave your feedback on what you learned about set and forget trading from this article.

I’ll look forward to hearing from you, and wish you nothing but success in the markets while seeing real progress towards your trading goals.

Watch a live price action breakout pullback setup for +110 points (+2R) on the FTSE 100. In this forex trade video, the first thing I establish is my trading ‘framework‘ which is the process and format I go about choosing my price action trade setups. Then I talk about the price action context and how that helps me establish what trading strategies I want to use. Once I have this, I show you how I pick my entry,  stop loss placement and take profit. If you want to learn to make trade setups like this, check out my price action course where you get access to our members trade setups forum, private member webinars, trader quizzes, and a free ‘trading analytics‘ session with me where I do 20+ metrics on your trading and give you actionable insights on increasing your accuracy and profitability.

Read more

Chris Capre’s current live open price action & ichimoku trades: AUDNZD, CORN, WTI, USDCHF, USDMXN

New to Forex? Then check out my FREE Learn Forex Trading Course with videos, quizzes and downloadable resources

Want to find unique trading opportunities? Check out my latest trading video on how to find dynamic support & resistance.

AUDNZD – Sitting On Top of Role Reversal Level (daily chart)

Price Action Context

The overall price action context on the AUDNZD has been bullish since the RBNZ rate cut. The forex pair recently broke through a key role reversal level around 1.0710 creating a great breakout pullback setup. ST bulls can watch this area for potential support. As long as this holds, the line of least resistance is up.

audnzd role reversal level

Trending Analysis

ST bullish while above 1.0710. MT bullish while above 1.0475.

Key Support & Resistance Levels

R: 1.0825, 1.0948

S: 1.0710, 1.0475

Stay tuned to the members market commentary for updates.

******

GBPCHF – Short Trade Idea on Break of CS Profits (1hr chart)

Price Action Context

In our recent market commentary, we talked about the ST corrective structure on the GBPCHF and intimated the bulls would start unwinding their longs and put bearish pressure on the pair.

We also suggested a break of the ST support level around 1.2334 would create a selling opportunity. As you can see from the chart below, this is exactly what happened.

Congrats to the members who profited from this trade setup.

gbpchf corrective structure 2ndskiesforex

Trending Analysis

ST & MT bearish while below 1.2334 on a weekly closing basis.

Key Support & Resistance Levels

R: 1.2334, 1.2260

S: 1.2184, 1.2012

******

USDJPY – ST Bullish Ichimoku Structure, But MT Bearish (daily chart)

Ichimoku Context

ST the ichimoku structure on the USDJPY pair is bullish as the pair is currently above the daily kumo, and had recently pulled back to the flat bottom and bounced solidly.

usdjpy ichimoku trading 2ndskiesforex

Trending Analysis

ST bullish while above the daily kumo on a closing basis. MT still bearish while below the A or D swing point around 109.02

Key Support & Resistance Levels 

R: 109.02, 110.57

S: 107.03, 105.24

Chris Capre’s current live open price action and ichimoku trades: USDJPY, AUDCAD, SLV, AUS200

New to Forex? Then check out my FREE Learn Forex Trading Course with videos, quizzes and downloadable resources

Did you see my live trade setup on the AUDCAD? Don’t miss how I grabbed a quick +125 pips of profit breakout trading with a near perfect entry.

AUDNZD – Big Winner vs NZD 50bps Rate Cut, Staying Long (1hr chart)

Price Action Context

While MT in a bear trend, ST the AUDNZD is a in a bull trend after bouncing off the key support near 1.0298, and then sky-rocketing after the surprise RBNZ 50bps cut. Notice the breakout pullback setup off of the prior ST highs near 1.0453 as the level held perfectly and has produced a decent bounce thus far.

audnzd-breakout-pullback-setup-2ndskiesforex

Trending Analysis

ST I’m staying bullish and am expecting a move north to pass 1.06+. Traders not already long should look for pullbacks towards support for potential buying opportunities.

Key Support & Resistance Levels

R: 1.0545, 1.0615

S: 1.0454, 1.03

What’s Inside?

-Tell me about your instruments
-When not to trade breakouts
-Let’s look at where you take profit

In the world of forex trading, if you’re not making money now (over a decent period of time), most likely you have to make some changes. To make money with forex, you will probably have to change the way you think, the way you trade, and the way you perform.

In today’s article, I’m going to share with you 3 things that will make you more money trading. If you want to improve your trading performance and make money on forex, consider making these 3 changes to your trading now.

#1: What Kind of Instruments Do You Play?

As of today, I’ve seen over 10000+ myfxbook accounts. Now I have an important question for you.

Out of all the students who’ve given me a myfxbook account for their first time, how many of them were trading only instruments they profited with?

Any guesses?

If you said ‘zero‘, you were correct.

Think about that for a moment…the first time you use myfxbook and start tracking your trading stats, the chances you’ll profit on every instrument you trade is likely zero!

In other words, you’re trading forex pairs and instruments you are not profiting from, and most likely won’t.

Below is a screenshot of a live myfxbook account for one of my students ‘Ahmed‘ (who’s well in profit).

instrument performance myfxbook

Notice anything? He’s lost every trade on the AUDJPY.

Now as long as you have a decent amount of trades for an instrument, if that instrument you’re trading has all losses, you should remove it from your trading plan and not trade it again for at least one year.

By taking off the instruments you have the most losses with (from my experience), can add between +3-10% of profit towards your bottom line per year.

That can be the difference between losing money and making money trading. It can also be the difference between making decent money, making great money with forex.

Hence look at your trading instruments by clicking on the ‘symbol‘ tab under your myfxbook trades and isolate the ones you lost the most money on.

Make sure to a) record the number of trades per pair, b) total accuracy %, and c) total profit/loss {in %} for each forex pair. Those 3 metrics alone will likely tell you which pairs and instruments you need to stop trading.

Oh and Ahmed whose trading stats you’ve been looking at?

He made a +300% profit in the last 6 mos (see below).

ahmed 300 percent 2ndskiesforex

NOTE: Do you want to learn how to make money trading price action? Find out more by seeing our price action course.

#2: When Not To Trade Breakouts

I have many different trading strategies, but I definitely trade breakouts. And I’ve shown I make money in forex trading.

I have a unique approach towards trading breakouts which you can learn about here.

But there is a key time to trade breakouts, and places on your chart you should not trade breakouts. Today I’m going to talk about two places you should not trade breakouts from.

1. Don’t trade breakouts in the middle of a corrective structure (range)

If you think about the order flow behind a corrective structure (see image below), you can see there is a balance between the buyers and sellers.

corrective structures support and resistance levels 2ndskiesforex

There is a ‘balance‘ because both sides relatively agree on where the price (or value) of a forex pair (or instrument) should be.

The bulls say the floor of the corrective structure is where they see the most value, and bears see this at the top. That is why the range persists, because both sides are participating at clear levels and zones.

This means their no directional winner in the order flow (bulls/bears). And this is what we mean when we say a corrective structure is ‘balanced‘.

In the middle of any range or corrective structure, there is the least profitability available for trading a  particular direction (i.e. trading breakouts) because there is an approximate 50% chance the market will go up or down in the middle of any range.

So avoid the middle of the corrective structure and range for trading breakouts.

2. Don’t trade breakouts just before a major support or resistance level

Looking at the chart below, you see the top line is a major resistance level, and just below it is a breakout formation.

breakout failures

These often form to create the illusion the market will keep going higher through the major resistance level. It can also form by bulls encountering the first layer of a resistance zone which is why the market kept pausing just below the level.

Whichever the reason (or both), I do not recommend trading breakouts just below/above a key level.

Better to wait till the price action is just below/above the actual support or resistance level. If you have less experience with this, we recommend taking a breakout pullback setup (see below).

breakout setups

#3: Let’s look at where you take profit

There are many components to your trades you’ll need to study, analyze and refine. One of those is where you take profit, or your TP.

Now I’d like you to do a little experiment with your own trading account (demo or live):

I’d like you to look at every trade you made money on. Now look at the data in myfxbook, and see how many of those that a) closed at your TP, b) closed manually before your TP.

Record how many trades you made of each (close manually/hit TP), and see which one made more money.

If it’s ‘a‘, then you likely have a solid grasp of finding good targets you can hit consistently. So no need to close them early.

This is what is called set and forget trading.

If it’s ‘b‘, that means you have a good grasp of when your profitable trades are going to turn around, and should continue manually closing your trades.

One last final metric is to look only at the ones you closed manually before they hit their TP, and see if they would have hit your TP anyways before hitting your stop loss (SL).

If that is true, then you’re missing a lot of profit (losing money) by not holding them to their full take profit and should stop manually closing your trades.

losing money trading

In Summary

We covered 3 main points in this article. They were:

1) Analyze your performance for each forex pair and trading instrument

2) When not to trade breakouts

3) Examine your take profit targets

Now that you know why you need these 3 things to make money trading, it’s time to do the work and find leaks in your game, while increasing how much money you make per trade.

Do you want to learn several more ways to increase your profits and how much money you make per trade?

Then check out my Price Action Course where you get life-time membership, access to the members trade setup forum, market commentary and a free skype session with me, so quite a lot.

To learn more about making money with forex, click here.

Now make sure to tell me what you thought about this article and if these 3 things will help you make money trading.

By now we have fully entered the summer trading months which are traditionally slower to begin with. When you combine the summer + the lack of ‘flow information‘ shared by bank traders under investigation, you have an environment of lesser volatility, smaller moves, and more false break setups.

With that being said, how can we maximize our time, while still remaining active and consistently profiting? Below is a mini how-to-guide for summer forex currency trading.

In this article, I will share 2 simple tips to help you trade pairs with stable volatility, larger moves, and also remain active during the slower summer months.

Summer Forex Currency Trading Tip #1: Switching Pairs & Instruments
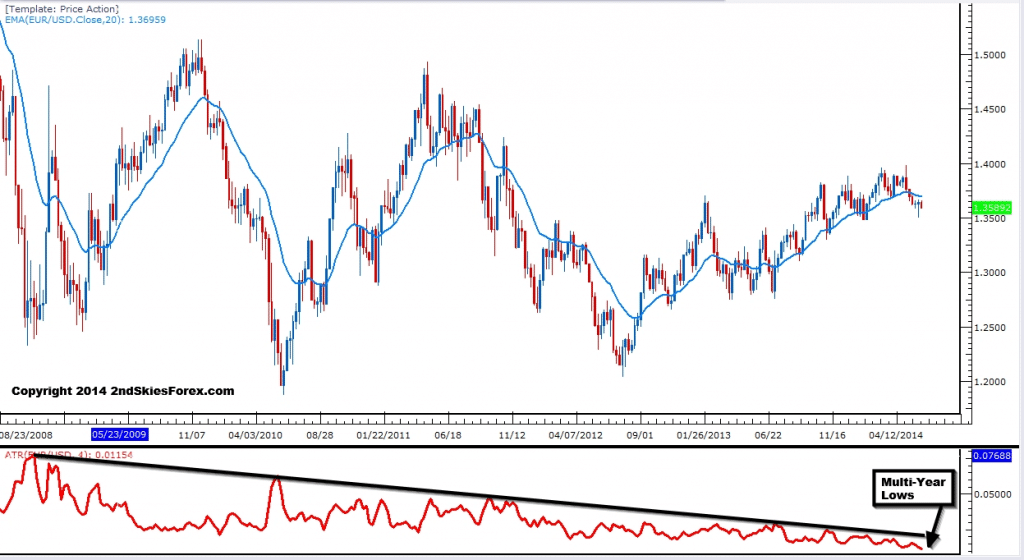
Below is the weekly chart for the EURUSD, the most heavily traded pair on the planet. Do you see that red line under the price action part of the chart? That is the weekly ATR which measures the average trading range (in pips) per week.

eurusd atr weekly chart

The average range of the pair on a week to week basis has been declining for years with it currently being at an all time low. It is the same for most majors, including the USDJPY and GBPUSD. If you are expecting a few hundred pip move on any of the above pairs, you could be sitting on your hand for days which is not the best use of your time. So what can you do about this?

My suggestion is to switch pairs that are more volatile. For example, instead of trading the GBPUSD or the AUDUSD, why not switch to the GBPAUD? It is far more volatile due to the ‘weighting‘ of the pair. If you can learn to spot good moves on the AUDUSD, then it will usually correspond to a directionally opposite move in the GBPAUD.

Take a look at the two charts below to get a better idea of this concept. In the first chart, we are looking at the AUDUSD 1hr intra-day chart. You’ll see the pair selling off heavy in the middle of the chart after a breakout pullback setup around 9330.

audusd 1hr chart breakout pullback setup

The trade happened in the Tokyo session, and took about 1.5 days to drop 135 pips. Now take a look at the chart below of the GBPAUD at that same time and notice the pattern.

gbpaud breakout pullback setup 2ndskiesforex

As you can see. the GBPAUD also make a breakout pullback setup off the role reversal level, yet it runs for +300 pips (a larger move by 2.2x). The size of each stop would have been relatively similar, which would have led to more profit on the second trade, and money in your account. Even an every day 40-50 pip directional move in the AUDUSD can lead to a +120 pip move in the GBPAUD.

Thus start looking at pairs which are naturally more volatile, and will be less affected by the lack of ‘flow information‘ shared by bank traders who are currently less active.

An additional suggestion would be to add other instruments, such as global indices and commodities. The Asian indices such as the Nikkei 225 and Hang Seng tend to have consistent volatility.

Along those lines, recently spent time with an HFT trader at IMC (Chicago). He mentioned how IMC is quite active in trading the Asian indices because of the higher volatility. Gold and WTI Crude Oil will also offer some greater volatility. Same with the German Dax and FTSE 100, so consider expanding your instruments giving you multiple options to trade.

Summer Forex Currency Trading Tip #2: Spend More Time Training
Since you are naturally less active during the summer months, why not use that time to build your trading skill set? Forget the idea of walking away when there is no trades to play golf, watch a movie, or read a book.

You want to be a professional trader who has the freedom of working from home, not having a boss who tells you what to do, what to wear and how much you get paid.

Do you get better at golf by sitting on the beach? Do you get better at playing guitar by reading novels? Do you get better at martial arts by playing video games? No, so why in the world do you think this applies to trading? It doesn’t, hence take advantage of the time available.

For those not familiar with it, Forex Tester 2 is a fantastic live simulation platform. You can take virtually any pair, and load up 13+ years of data on any time frame, then live forward trade it as if the price action was forming in real time.

I did a great video on forex training with Forex Tester 2 which shares several ideas how to accelerate your learning curve. This is especially relevant for those trading daily and 4hr strategies.

Ask yourself how long would it take you to log 500 trades if you only trade the higher time frames? Years perhaps? In less than a week, you can log the same amount of trades in FT2.

Think of it being the equivalent training of the golfer at the driving range, hitting ball after ball. Professional golfers on average will hit 500 balls a day. Do you think that helps their golf game and perfect their swing? Ponder that a moment for those of you only trading 3-5x a month, and how long it will take you to build your skill set.

I’ve had several students log thousands of trades after a few months using FT2. Go figure their trading is improving the most, and showing the greatest profits over the last few months.

NOTE: In the link I shared above to the video on FT2, there is a link where you can get a $50 discount on it.

Along the lines of using FT2 to improve your trading performance, I recently did a private member webinar, where we showed a myfxbook account from one of our students. He is trading over 70% accuracy, and up about +96% on his live trading account, with his average wins well out-sizing their average losses. He profit factor is currently +3.08 and is up +1780 pips for the last 4 months.

Below is a screenshot from their myfxbook page we discussed in the webinar.

2ndskiesforex student profit live myfxbook account using price action

They trained over and over again in FT2 and are a member of my price action course.

While others are being lazy traders, they are building their skill set. If anyone is going to really trade for a living, it will be the ones who put in the hours and properly train.

In Summary
These are just a few tips you can use to help stay consistently profitable trading forex in the summer, while using the time effectively to build your trading skill set.

There are many more tips which I share with my course members, along with more ways to utilize Forex Tester 2, building a successful trading mindset, how to train properly, along with adjusting to the ever evolving markets in real time.

Today’s article will focus on forex trading support and resistance key levels as this seems to challenge many developing traders. Learning how to trade support and resistance key levels is critical, because in essence, this is where;

a) you will be placing your stops and targets, and

b) this is where the institutional traders are getting in

In reality, forex support and resistance trading levels are like ‘doors’ or ‘walls’, either they will be open or closed – either they will break or they will hold shut. Your success in support and resistance trading will be in determining when they will hold, and when they will break.

trading support and resistance key levels breaking through resistance 2ndskiestrading.com

Thus, it becomes essential to learn how to read key levels so you can have a well defended stop, a highly efficient entry, and also have proper timing.  In this resistance and support trading strategy article, I will cover two powerful tips for finding these key support and resistance levels.

#1: Minimum of Two Touches
Before you can consider a level to be used as support or resistance, you will want a minimum of two touches.

Why?

Imagine you are in a strong downtrend, and the pair rejects off a particular price heavily – perhaps via a long tailed pin bar.  You have to consider, with trend traders are just going to see this as a test. The bears know there are buyers off the price where the bottom of the pin bar formed, but they are not going to give up control of the trend just from a simple pin bar.

They are going to retest this level to see if the buyers there are strong enough.  If they break it, then the trend and profits will continue.  If not, then they will take profit, but it’s unlikely a reversal will start immediately.  A good example of this is in the chart below.

GBPUSD Daily Chart
pin bars support and resistance key levels price action 2ndskiestrading.com

Looking at the chart above, we can see the pair is in a strong downtrend.  In the middle of the chart at A, it forms a counter-trend pin bar. Now although the pin bar body is at the prior support area, the tail is way below, and its the bottom of the tail where the buyers entered in, not at the support area.

Thus, the bulls at the support area were likely stopped out when price dipped 100 pips below, & the rejection from the pin bar occurred at a place with no two touches. So this would not be a pin bar to buy as you can see failed whether or not you used a 50% retrace entry (which can be quite inefficient).

You will also see the same later on with the pin bar at B, which also had a low at no known support area or formed a second touch.  This also would have been a loser.

Now notice the pin bar at C which is with trend. You will notice the pin bar formed a second touch off the level two candles back.  This would have been a good price action setup to get in because the second rejection would have confirmed the level.  And you will notice, it turned out to be a winner.

So the main takeaway from here is look for the two touches, because with a one touch, the with trend traders will re-attack that level. And it should be noted there is a far more efficient entry than the 50% retrace entry which I will discuss in next week’s article, but keep in mind, after long tailed pin bars, you don’t have to worry about missing the entry.

Why?

Because if it is going to reverse, the greater probability is that a re-balancing, or ‘re-distribution‘ of the order flow will begin.  This mostly likely will creating a range, or a corrective pullback.  This is also why when you have an impulsive price action move, followed by a corrective price action move, it is more often followed by another impulsive price action move.

This is also the reason why an impulsive price action move is rarely followed by a counter-trend impulsive price action move. From an order flow perspective, this is because if the sellers are heavily in control, the buyers will have to overwhelm the sellers, and this requires a lot more money and orders then the current bears in control.  This is the reason why V-bottoms are more rare than common.

#2: Trading With Trend Increases the Probabilities
You might have noticed with the chart above, that trading with trend was more powerful than trading counter-trend. As a whole, counter-trend trades are a lesser probability trade, so they take more skill, experience, and precision. This is simply because you are trading against the majority of the order flow, so the odds are already stacked against you.  For those still having trouble getting consistency, I’d recommend trading with trend as much as possible.

Now if you are in a range, then there is no dominant trend, so trading reversal type plays are suggested, particularly at the tops and bottoms of the range. But when a strong trend is in play like the one above, you will find greater profit potential and accuracy trading with trend instead of counter trend.

This also holds true for trading support and resistance levels.

Why?

In a strong trend, the larger players are just looking for key levels as areas they can get in with trend.  This is traditionally known as a breakout pullback setup, and generally does not need two touches off the level to confirm its effectiveness.

Why?

Because likely, in a trend, there will be a support or resistance level that is already being challenged, which would confirm there are buyers or sellers at the level trying to defend it, while the other side is attacking it. Once it breaks, the with trend traders often look for a pullback towards this level to get back in with trend. A great example of this is in the chart below.

AUDJPY With Trend Setups 4hr Chart
breakout pullback setup trading with trend price action chris capre 2ndskiestrading.com

Using the chart above, starting with the bottom left, price climbs consistently, gapping up, but then forming a resistance area at A. After a brief pullback, we can see price breaks through forming a new SH (swing high).  The market then pulls back to the level at A, and at A’, forms an aggressive engulfing bar which starts the next up leg for over 400+ pips before forming a pullback.

The pullback at B which forms the next resistance high, dips just below the 20ema and forms a with trend pin bar. This marks the new impulsive leg up towards 95.00. Then price pulls back towards the level at B, and at B’, double bottoms (two touches) and starts another leg up and a nice with trend entry.

After a marginal break higher, price pulls back and forms another with trend pin bar below the 20ema, which starts another up leg towards a resistance at C. Sellers enter at C, and after a short pullback, break above it, with a brief consolidation at C’, offering a great breakout pullback setup to get in with trend.

Keep in mind, in all of these with trend pullbacks, the market pulled back towards the levle that it hat the strongest rejection from at A, B and C. The strong rejections at those levels are counter-trend players, trying to stop the trend. But when the bears tried to get past the last major resistance, now turned support (forming a role reversal level), the bulls used this as an opportunity to get long.

Yet in almost every case where the market formed a resistance, when the market attacked that level again, the sellers failed to hold the level. This is because they were going against the major order flow, which highlights how much easier it is to find key support and resistance levels that work when you are trading with trend, and not counter trend. So hopefully this highlights the difference.

In Summary
Finding key levels, and major support and resistance trading levels is not some Da Vinci code type endeavor. Two key things which really help this are using the two touch rule, along with trading more with trend than counter trend. Of course, there are other key clues to understanding support and resistance, but if you can employ these two techniques, they will greatly enhance your ability to find key levels, and make highly effective trades around them.

The learning process never ends for a trader.   The market is always evolving and you have to adapt. Algorithmic trading was about 3% of the FX market in 04′.  Now 28% of it is just HFT’s alone! Think that has changed the intraday price action?  Absolutely!
Thus, you must always be learning, evolving and challenging yourself.  There are always refinements and greater depths to what you are doing, whether you are trading price action, ichimoku or other rule based systems.
Regardless of your skill level in trading, you are going to make mistakes.  I make mistakes, but I learn from them with alacrity.  I quickly analyze what I did wrong, visualize what I would do differently, clear my mindset and get back to business.   The difference between a professional & beginning trader is usually two-fold;
1) they make less of the typical mistakes beginners do
and
2) they rebound much faster, control the damage quicker and get back to business
Analyze your last year of trading in your journal.  I’m willing to bet if you eliminated just one or two mistakes you continually repeat, your current losing year would have been a profitable one.  If you ended the year break-even, then it likely would have been highly profitable.
Eliminating mistakes is one of the fastest ways to profitability. The sooner you discover, eliminate and transform them, the faster your equity curve will climb.
Thus, in the spirit of this, I will share my top trading mistakes for 2012 in the hopes you can learn from them.
1) Trading and Investing are Two Different Things
I am a trader first and foremost, but I also am invested long term in physical gold.
To ‘invest’ in physical gold, you constantly have to understand what is happening in the physical AND paper market.  It helps to study central bank buying of gold, physical supply, how it is used as a safe haven against bad governments, etc.
However, I also trade gold using intraday price action strategies, and sometimes my methods/opinions on one get mixed with another.  Long term I am a bull on gold, and have been since 2004/05 back at the $400 levels.
Many times in the last 3 months, I was long paper gold.  Yet intraday price action would be screaming for me to get short.  My broker allows hedging – so why wasn’t I shorting physical?  Because my long term investing bias was interfering with my short term trading methods.
One of my top trading mistakes for 2012 was forgetting that I am a trader first and foremost, and to not let my bullish bias or investing strategies interfere with an obvious price action setup.
A good example is I bought paper gold at $1633, which I blogged about as a high probability breakout.  At one point I was up 51x my risk, meaning for the 300 pips I was risking, I was up about 15200 pips.
By the time I walked away from the trade, I was only up 6500 pips. I didn’t follow exit rules because of my long term investment bias.
Remember, a trader and investor are two different things, and you must understand the difference.
2) Trading Against Impulsive Price Action
One of the base models I use for trading is understanding impulsive and corrective price action.
To sum it up briefly, impulsive price action moves are when the institutional market is heavily buying or selling and driving the price action directionally.  With training and practice, you can learn to read the order flow behind price action, particularly by identifying these impulsive price action moves.
A few times this year I traded completely against these moves.  Case in point – meet exhibit A, ironically on……wait for it……Gold!
Gold 4hr Charts
impulsive and corrective price action gold trade 4hr chart 2ndskiestrading.com
Looking at the chart above, you will notice on the bottom left points A and B which showed strong price action rejections.  Buyers stepped in at this level, driving prices almost $50 higher in about 6 days.
At C you will notice the pin bar at C which was the second sign the bullish move was ending.  Any idea what the first was?
Regardless, after the pin bar, price action failed to make a HH (higher high) and started with selling off impulsively at D, then more sellers came in at E, and by F, once it broke the role reversal level, price got monkey-hammered dropping $30 in 4 hours.
I had a buy order at the support level at G, so made some profit on the bounce, but missed the fact the market was still showing impulsive price action selling.
So at H what did I do?  I bought some again, hoping for a similar move.  The result is below, but you get the idea.
Gold 4hr Chart Exhibit B
impulsive price action breakout pullback setup gold 2ndskiestrading.com
At the support level where my first long worked out, I went long again at H and the same level.  Shortly after I was stopped out.
Instead of realizing I was trading against the trend and impulsive price action, I was looking for a reversal. I consequently missed the obvious breakout pullback setup at the same level I was looking to get long, which then became a role reversal level.  This is what happens when you trade against the trend and your system.
Not only do you miss several good with trend setups, but after you get stopped out, you usually miss the follow up trade from your price action system to take advantage of the move.
3) Let Your Trade Run Until Your System Tells You To Exit
Barring any extreme or black swan event, I usually just let my trade run until my rule based system tells me to exit.
However on a recent buy on the GBPJPY, after getting a great entry and banking about +300 pips, I exited the trade, even though my system was still telling me to hold long and hadn’t given an exit signal.
Looking at the chart below, you can see on the top left at B a critical resistance level which started the massive 300 pip sell off.
ichimoku strategy chris capre 2ndskiesforex gbpjpy + 300 pips
Price started to show signs of exhaustion, and started a reversal.  My ichimoku strategy picked up a buy order just above 126.60.  Shortly after, price climbed rapidly gunning it for the same resistance level at 129.50.  After the weekend gap rejected, I took profit banking about +300 pips.
Not so bad you say…until you look at the chart below.
ichimoku trading strategies chris capre 2ndskiestrading.com gbpjpy
Not only did my system hold on for another + 300 pips, but it gave me a re-buy signal around 132 and is still currently long today.  I missed that one as well from being ‘upset’ about exiting early.  Needless to say this would have over tripled my profits. Even though my system never gave me an exit, I got out of the position.
Not letting runners run is one of the most costly mistakes a trader can make.  Yes, it is important to understand what is a high quality signal, but I’m guessing if you let just 10 of your trades run until the system gave you an exit, you would have made almost double your profits on those 10 trades.  For me, it was actually 2.4x more.  Food for thought.
In Closing
Part of trading is making mistakes, but a key component of your success is learning from your mistakes and making less of them over time.  Regardless of your skill level or how long you have been trading, you will make mistakes.  Anyone who only posts their successes and doesn’t admit to their failures is hiding behind a wall of fear and a false reality.
I make mistakes and I’ve been doing this for 12 years.  But I learn from them continually and make less of them as time goes on.  This translates into more profits, smaller drawdowns, less emotions, and a smoother equity curve.
Eliminating mistakes is the fastest path to making more profits.  But the first step is becoming aware of them.  This is where the trading journal comes in handy.  If you’ve made 300 trades last year, are you really going to remember every mistake you ever made?  Unlikely, this is why you have a journal, to help you become aware of your mistakes.
The second step is to actively work on eliminating and transforming them.  If you repeat a mistake over and over again, then the cause is likely psychologically, and something that can be re-wired through ERT training and developing a successful trader mindset.
But the bottom line is you can transform your mistakes into strengths, and most definitely into greater profits.  In almost all cases, making less mistakes can be the difference between a winning and losing day, month or year.  And in almost all cases – will lead to significantly greater profits.
Kind Regards,
Chris Capre

While my trading team and I are mostly on vacation for the month of July, I wanted to write a brief article giving 2 key clues to understanding forex support and resistance levels, which is also a follow up to my prior article the best support and resistance levels part 1.  If you can learn to understand these two key points, you will be able to detect key levels, when they are more likely to hold, and when they are more likely to be broken.


1) Prior History, Time Degradation, & Reactions to Key Levels in the Past
When analyzing to see if a level is one where traders are more likely to place trades around, we have to see how price reacted to those levels in the past.

Did price react very strongly to it in the past, say approach it one time, then reverse sharply off of it?  If so, then its very likely the next time it approaches that level, traders will place orders around there expecting a similar reaction.


Why?

If price produced a very violent or strong reaction to it in the past, this was because a large amount of money was put on the line stating ‘this is the line in the sand, this is highly over-valued or under-valued and we are placing a large bet here’.  When this happens, its the first institution to get in that has the highest chance for profit, because they are the first to try and reverse the pair, thus getting the best price. But they also carry the most risk.

Regardless, if their reversal attempt works, other institutions will catch wind of this, and attempt to get in as close to the rejection level as possible.  It really becomes a race between the institutions who can get the best price so many vie for it.  This helps to further fuel the rejection and create a stronger reaction.

Smart traders take note of this level producing such a strong rejection and will more than likely take a play off of it a second time expecting it to hold.  If an institution placed a large amount of money at a key level, they will likely defend it a second time (along with others as well).  So expect this level to hold.

But…the reaction the second time around is usually not as strong.


Why?

Because more people are aware of it the second time.  If it was a support level that produced a violent bounce, the second time around the sellers heading into that level will take profit.  This means there is less of an opposing force on the sell side, so when the market bounces, there are less sellers who have to exit and thus fuel the counter trend play.

A good example of this is below in the daily Gold chart


Chart 1.1 Gold Daily
2 key clues to understanding support and resistance levels 2ndskiestrading.com july 20th

Gold was in a strong uptrend for all of 2011, eventually reaching $1900 an oz after climbing 3 out of every 4 days from July into mid August.  Looking at the chart above, gold sold off quite heavily after reaching the $1900 level, selling off almost $200+ in 3 days.

Notice how the second time it approached this level, it held, but took over 13 days to sell off the same $200 amount.  The first reaction was far more violent, while the second more tempered.  The level held just fine, but when you see these situations, expect the response to be not as violent but still providing a great trade opportunity.

So anytime you see violent reactions to a level, look to place a trade at that level, expecting it to hold and produce a similar measured move.  Obviously, if the reaction happens on a higher time frame, there is a greater chance it will produce a similar reaction.  Whereas on a lower time frame, this will probably be less likely so be a little more choosy when looking to make a play like this.

Other factors to consider besides the strength of the reaction when understanding support and resistance levels is if the level produced a breakout pullback setup, has held several times in the past, and how much time the market spent at those levels.  All of these factors will determine if there is a good setup there at that level.


2) Current Price Action
So often when people talk about levels, they only focus on the past and seem to forget to look at how the price action is behaving in the present.  Just because a level held nicely in the past doesn’t mean it will this time and you’ve probably experienced this, expecting a level to hold only to watch it get broken.

By learning to read the price action in real time, you can see if the market is approaching it with strength or weakness, impulsive-ness or corrective-ness, and then use this information to determine if a level will hold the oncoming assault or buckle forming a breakout or trend continuation.

Levels are just areas where traders place orders, but if the defenses of those levels are weak, they will not withstand the attack, so it is crucial you are always watching price action in real time to determine if this will hold.

Although I place my orders at key levels I think will hold, if the market is approaching it with several signs of strength, then I will consider waiting for a price action trigger at this level, or for it to hold before placing my order.

Below is an example of a key level that held in the past, but completely failed the second time with the market showing strength and signs it was going to fail.


Chart 1.2 EURUSD Daily
key clues to understanding support and resistance levels 2ndskiestrading.com july 20th chart 2

When the EURUSD started its massive sell off in late April, it did so in impressive fashion shedding over 600pips in 13 days with only one bull candle in the entire selloff.  When it was approaching the yearly low (at B on the chart) around 1.2627 in 2012, notice how the selling started to pause going from really large impulsive candles to two small doji-like candles.  The transition or change from large candles to small suggested hesitation on the sellers part heading into a key level they suspected might hold.

This weakness and hesitation was a good real time price action clue the market was likely to produce a bounce from the yearly low, and bounce it did, forming an engulfing bar which bounced about 150pips in two days.  Many of our price action traders got in on this one, not only reading the weakness, but also using quantitative data on price action specifically for the EURUSD which communicated a likely reversal.

But notice what happens after a two day bounce – price then sells off aggressively again taking out the prior days lows and eating into over 75% of the two days’ gains.  This communicated to us in real time the sellers came back in force and were making an aggressive attempt to take out the level.  So this was a good price action clue not to place another buy order at this level.

Notice how after it broke, the level served as a key role reversal level which gives us an opportunity to get short and join the trend.

There are many other clues one can use to read the price action in real time to determine if the level will hold or break, but these are just a few hints you can look for, along with looking for price action triggers off these key levels and quantitative data to support your level as well.


In Summary
So these are just 2 key clues you can use to understand forex support and resistance levels.  It is critical to understand specifically how the market responded to a level in a past to determine first if it is a good level to make a play on.

But, so many times I hear traders talking only about how the market reacted in the past, and not paying attention to how the price action is developing in the present – which is a real time communication to the underlying order flow behind the attack on the support or resistance level.  By learning to read this, along with level 2 quotes, you can greatly increase your ability to understand and place trades around key levels, either using them for reversal plays, breakout pullback setups, or looking for potential breakouts around these key levels.

For those wanting to learn to trade price action and understand resistance and support levels, get access to the traders forum, quantitative data on price action, lifetime membership & more, visit my forex price action course page.